


Similar Questions
Explore conceptually related problems
Recommended Questions
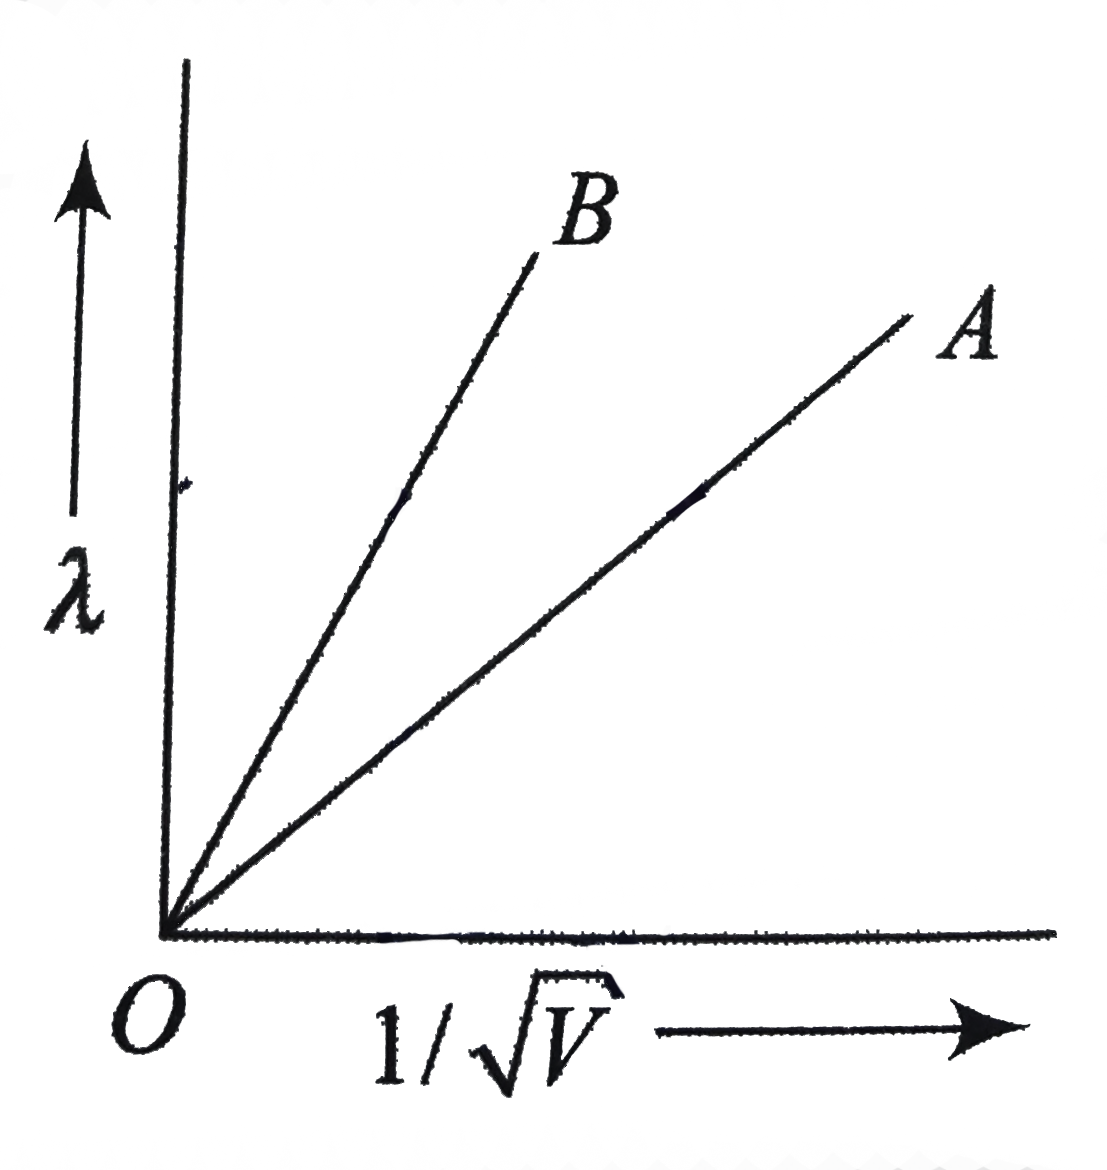
- The two lines A and B in fig. shoe the phot of de Broglie wavelength (...
Text Solution
|
- The two lines A and B in fig. shoe the phot of de Broglie wavelength (...
Text Solution
|
- Plot a graph showing variation of de-broglie wavelength lambda versus ...
Text Solution
|
- de Broglie wavelengths of two particles A and B are plotted against (1...
Text Solution
|
- Two lines, A and B, in the plot given below show the variation of d...
Text Solution
|
- Show that the de Broglie wavelength of charged particles accelerated t...
Text Solution
|
- Consider two particles of different masses. In which of the following ...
Text Solution
|
- Write the expression for the de Broglie wavelength associated with a c...
Text Solution
|
- Plot a graph showing variation of de-Broglie wavelength lamda versus 1...
Text Solution
|