


Similar Questions
Explore conceptually related problems
Recommended Questions
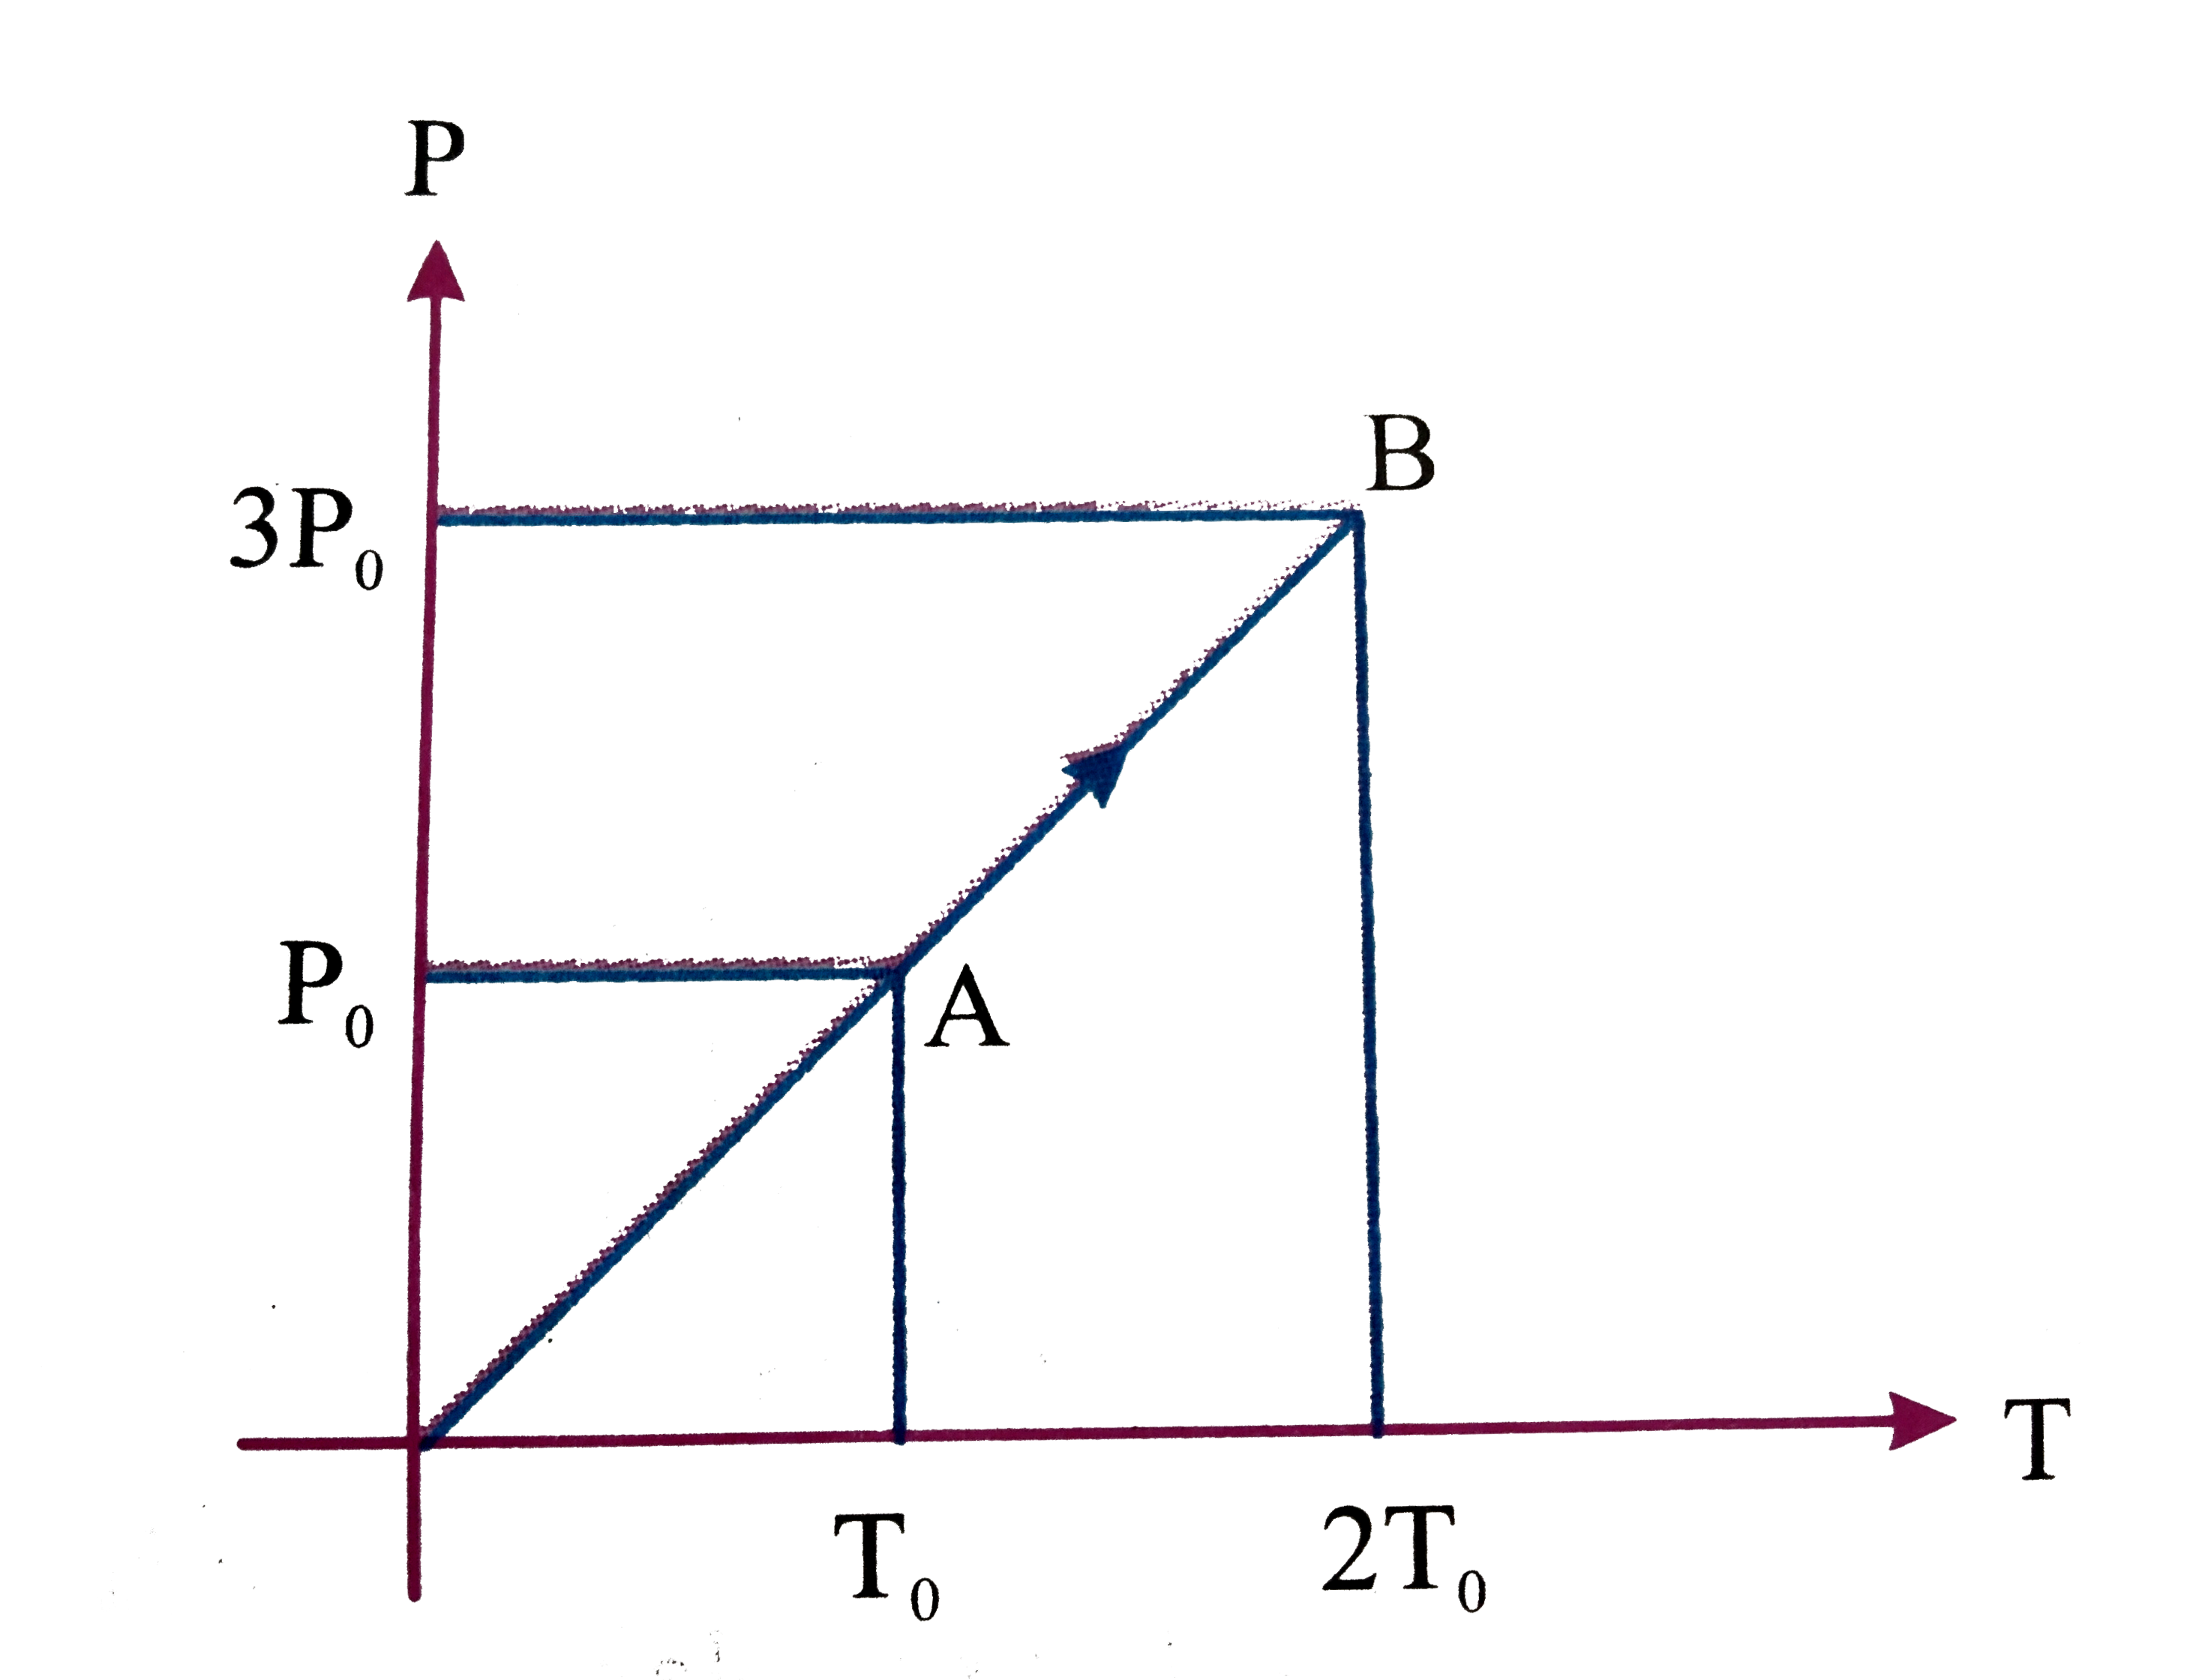
- Pressure versus temperature graph of an ideal gas is shown in figure. ...
Text Solution
|
- Pressure versus temperature graph of an ideal gas as shown in Fig. Cor...
Text Solution
|
- Figure shows graphs of pressure versus density for an ideal gas at two...
Text Solution
|
- Pressure versus temperature graph of an ideal gas is shown in figure. ...
Text Solution
|
- Pressure versus density graph of an ideal gas is shown in figure
Text Solution
|
- Figure shows graphs of pressure versus density for an ideal gas at two...
Text Solution
|
- Pressure versus temperature graph of an ideal gas is as shown in figur...
Text Solution
|
- P-V diagram of an ideal gas for a process ABC is as shown in the figur...
Text Solution
|
- Pressure versus temperature graph of an ideal gas is as shown in figur...
Text Solution
|