


Similar Questions
Explore conceptually related problems
Recommended Questions
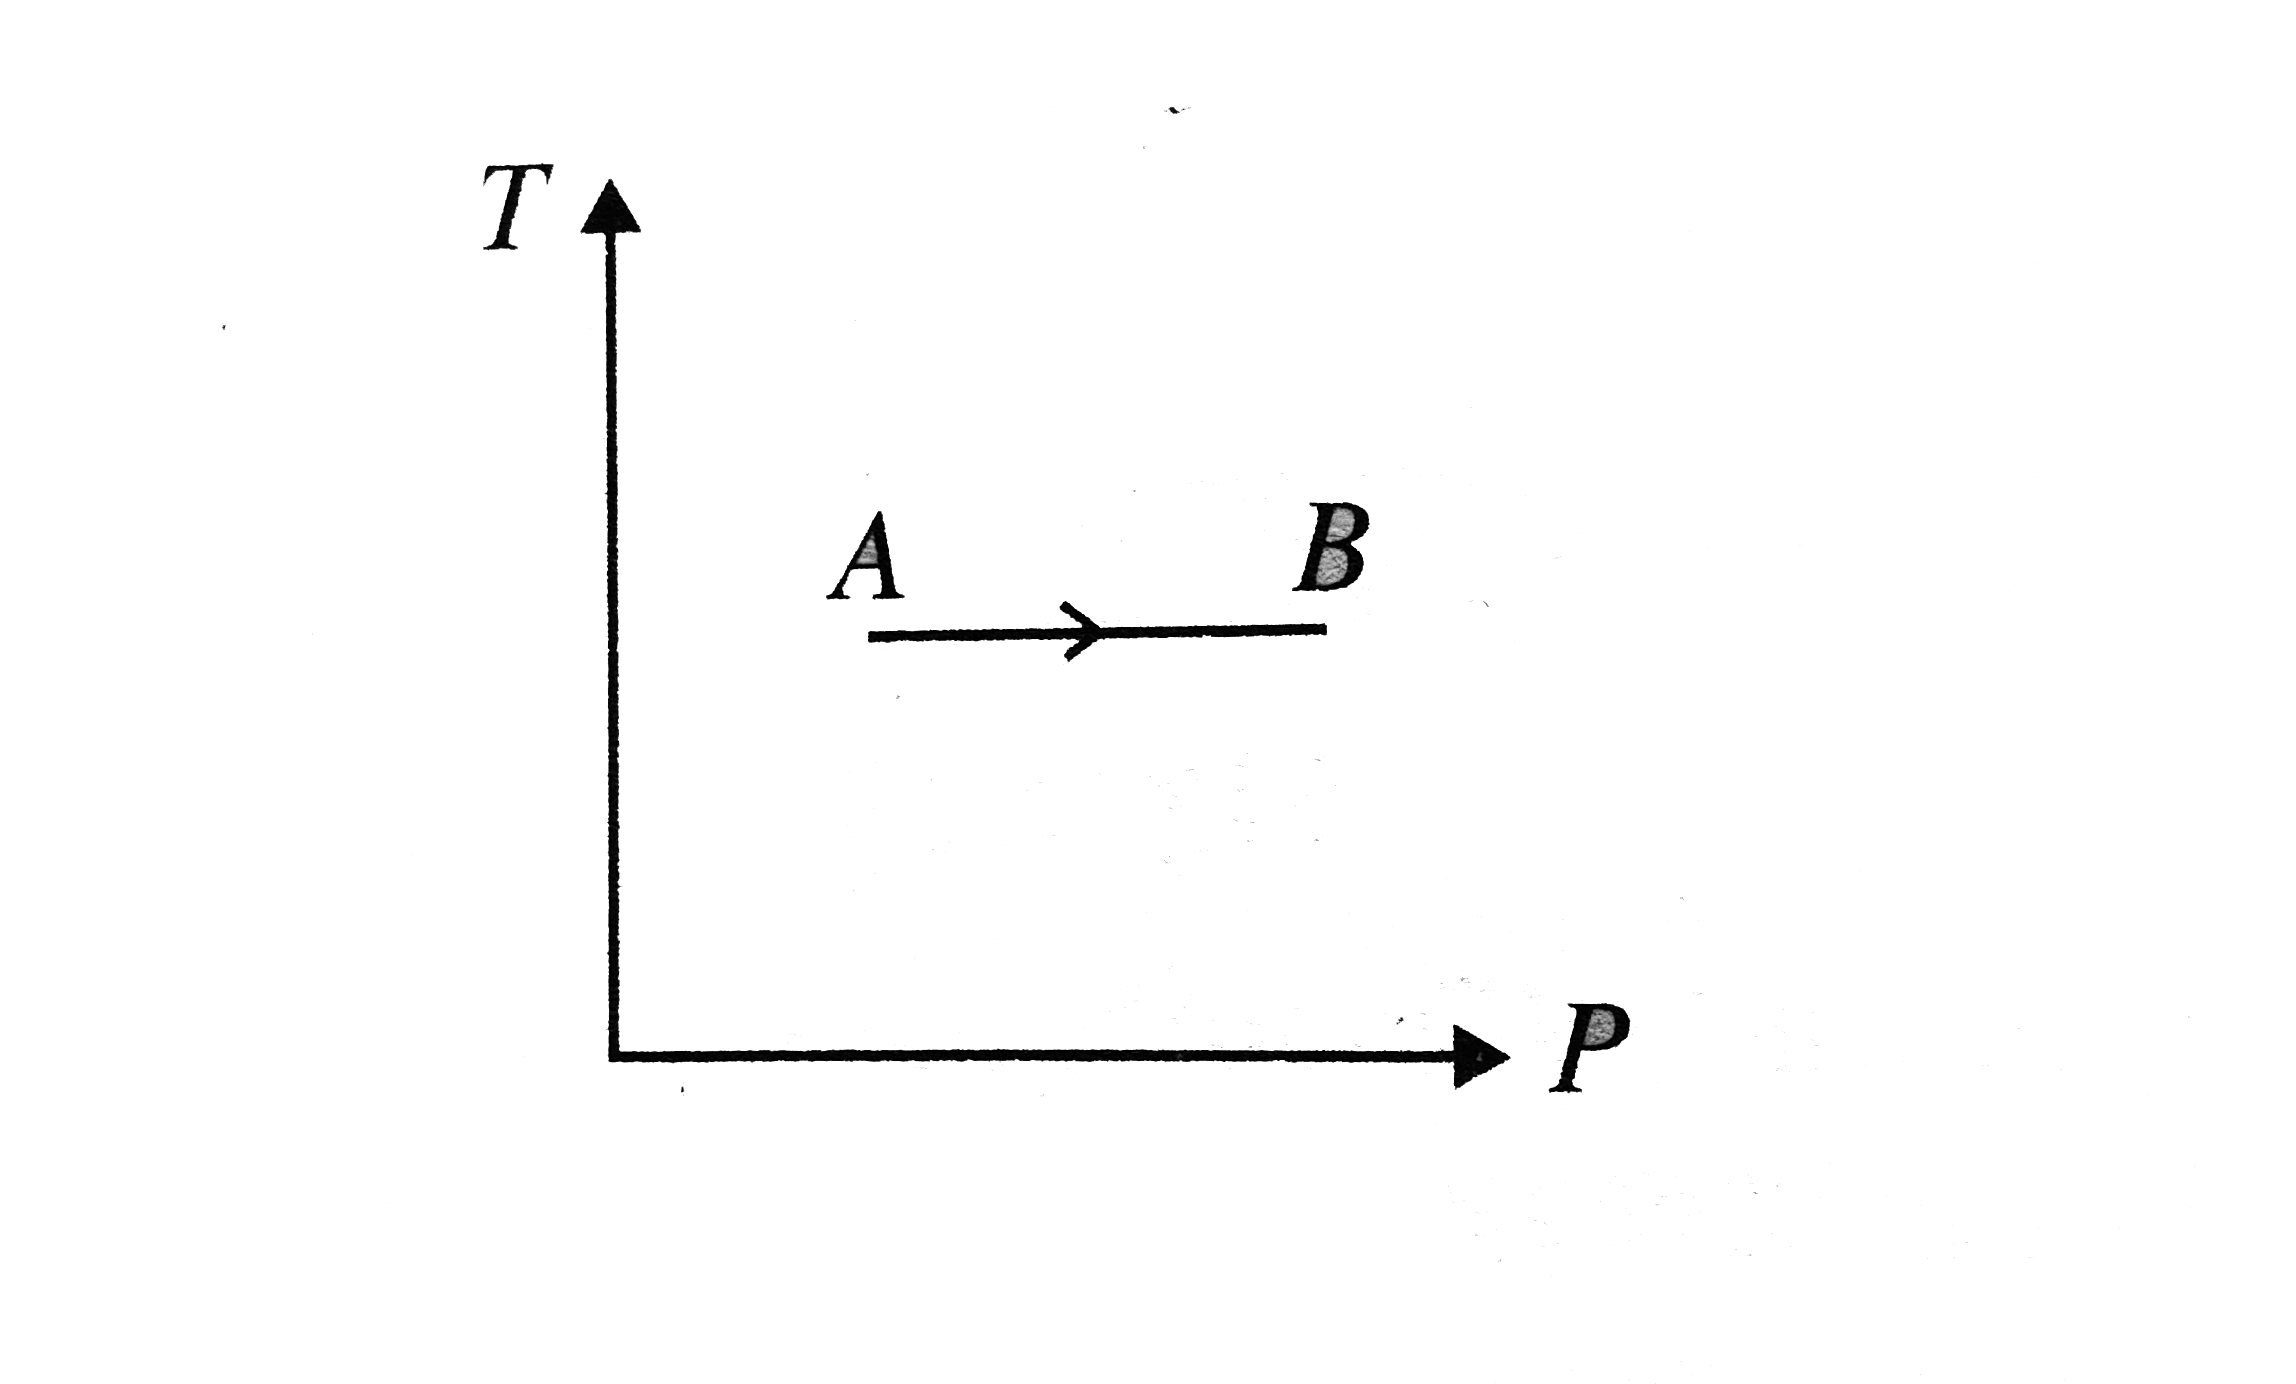
- Temperature versus pressure graph of an ideal gas is shown in Fig. Dur...
Text Solution
|
- Pressure versus temperature graph of an ideal gas of equal number of m...
Text Solution
|
- Pressure versus temperature graph of an ideal gas as shown in Fig. Cor...
Text Solution
|
- Temperature versus pressure graph of an ideal gas is shown in Fig. Dur...
Text Solution
|
- V-T diagram for a process of given mass of ideal gas is as shown in fi...
Text Solution
|
- Pressure versus temperature graph of an ideal gas is shown in figure. ...
Text Solution
|
- An ideal monatomic gas undergoes a cyclic process ABCA as shown in the...
Text Solution
|
- A graph of pressure versus volume for an ideal gas for different proce...
Text Solution
|
- Pressure versus temperature graph of an ideal gas is as shown in figur...
Text Solution
|