


Similar Questions
Explore conceptually related problems
Recommended Questions
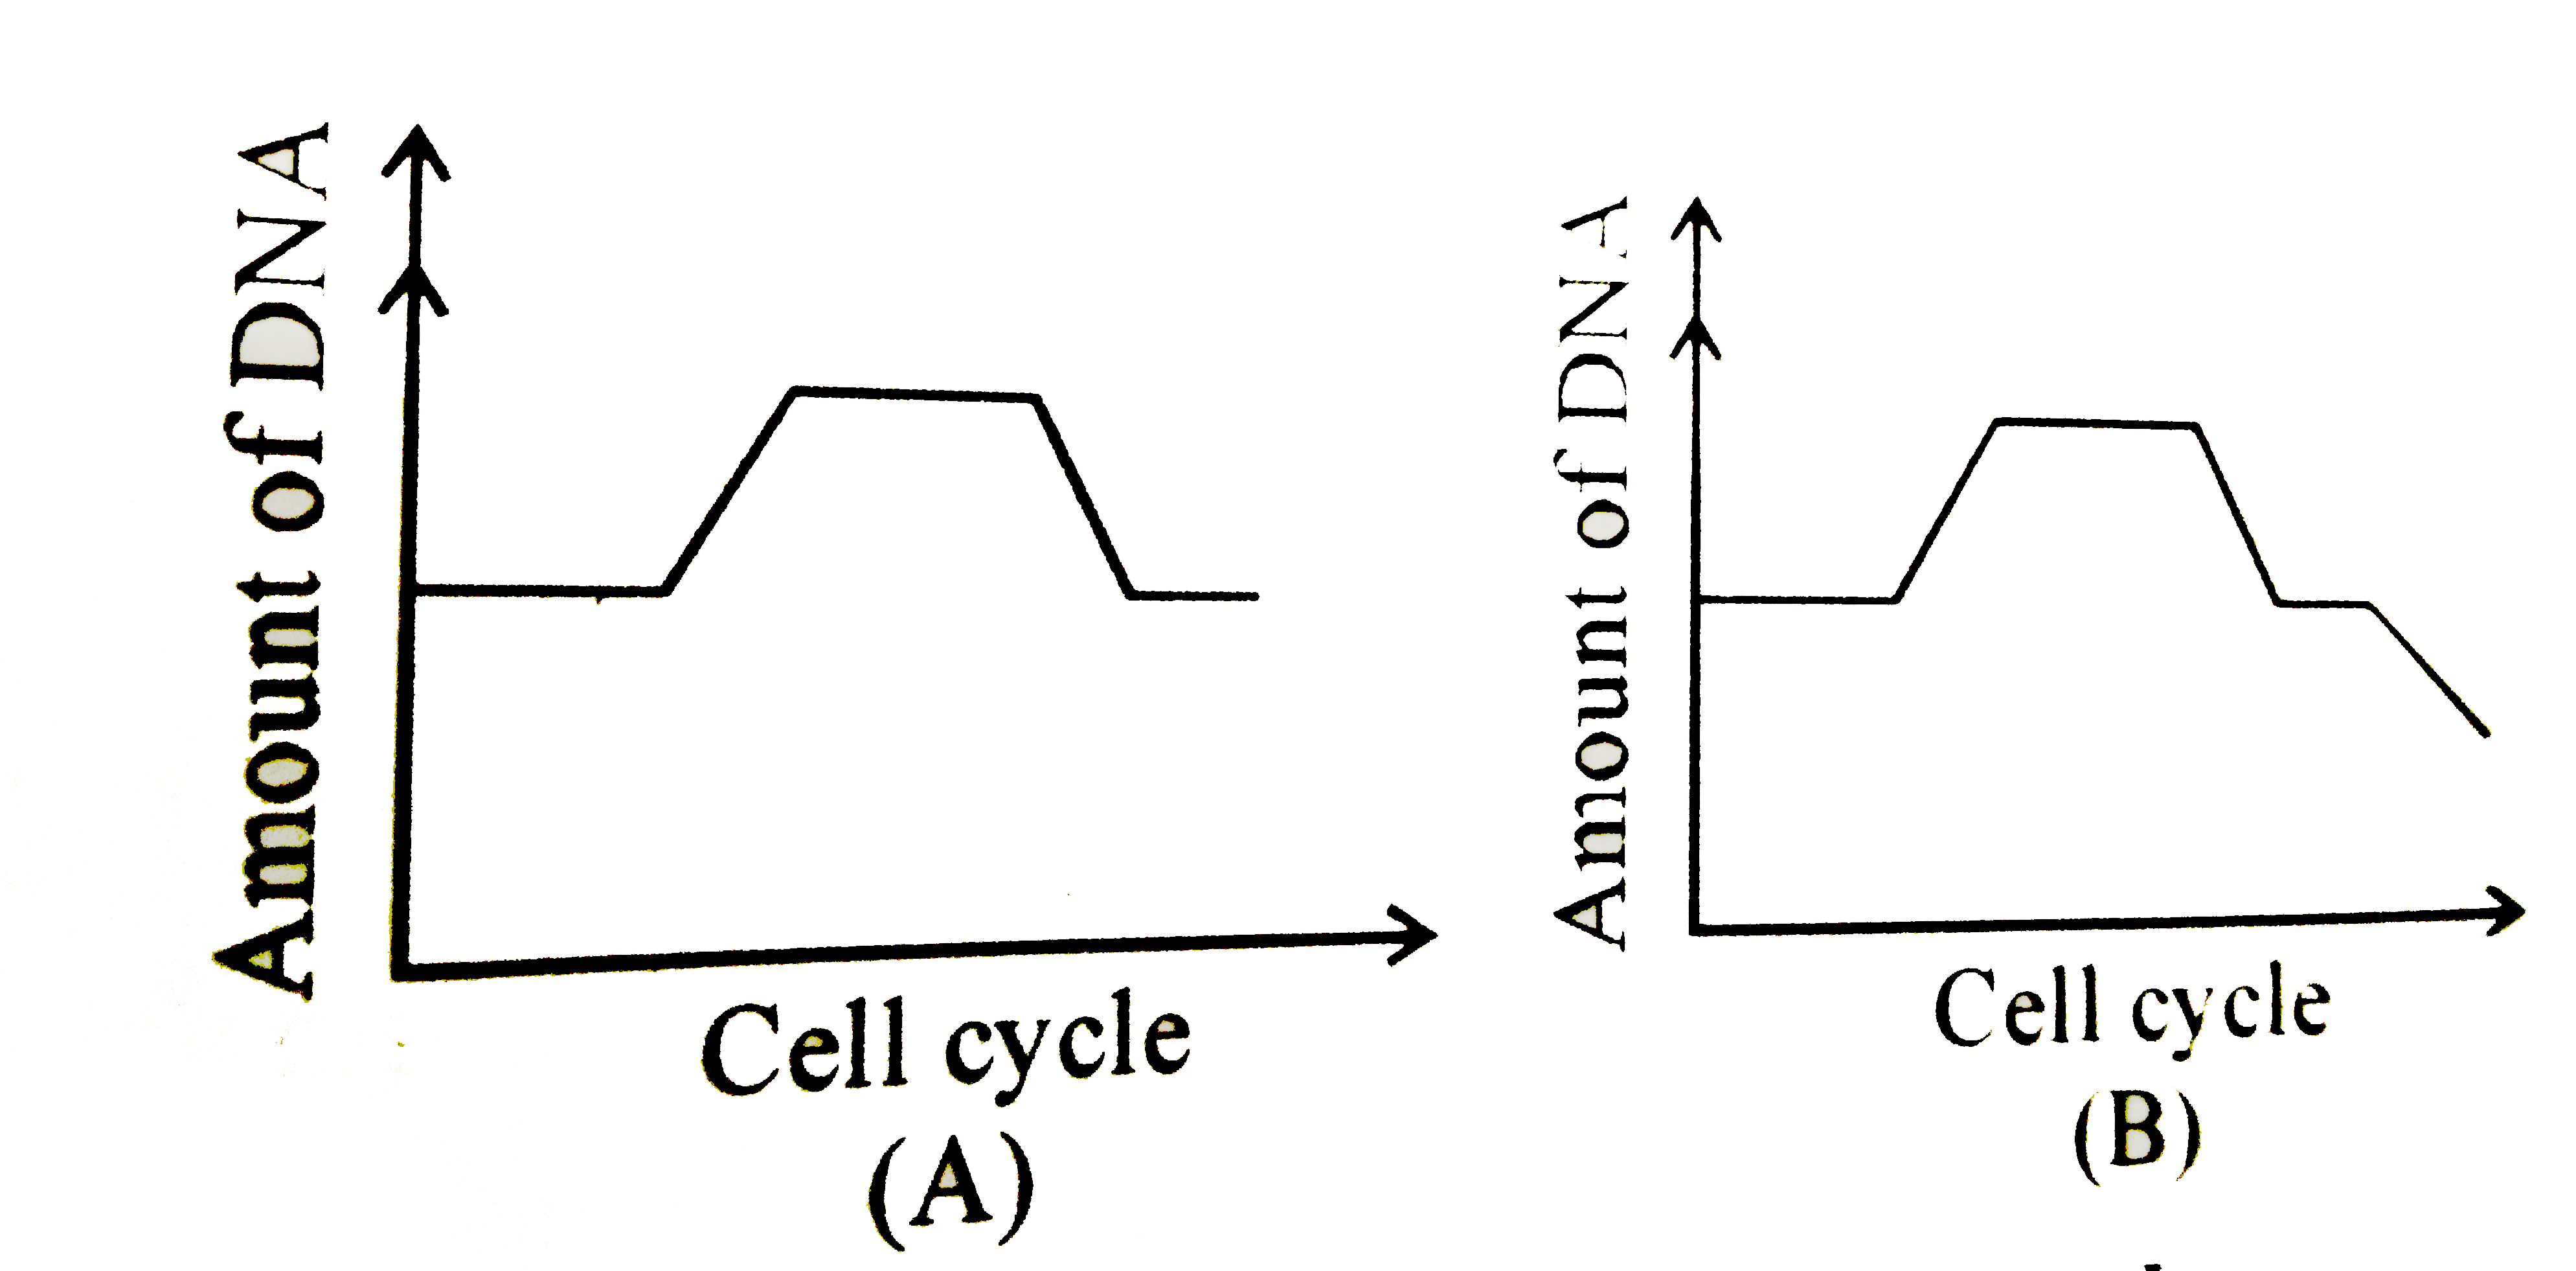
- The following graphs (A and B) depicts changes in DNA Content during c...
Text Solution
|
- The given graph shows the change in DNA content during various phases ...
Text Solution
|
- If DNA content of a dioploid cell is 'z' in the G(1) phase of the cell...
Text Solution
|
- The following graphs (A and B) depicts changes in DNA Content during c...
Text Solution
|
- Analyze the events occurring during every stage of the cell cycle, how...
Text Solution
|
- Name the event during cell divison cycle that results in the gain or l...
Text Solution
|
- The given graph shows the change in DNA content during various phases ...
Text Solution
|
- Anaylse the events during every stage of cell cycle and notice how the...
Text Solution
|
- Analyse the events during every stage of cell cycle and notice how the...
Text Solution
|