


Similar Questions
Explore conceptually related problems
Recommended Questions
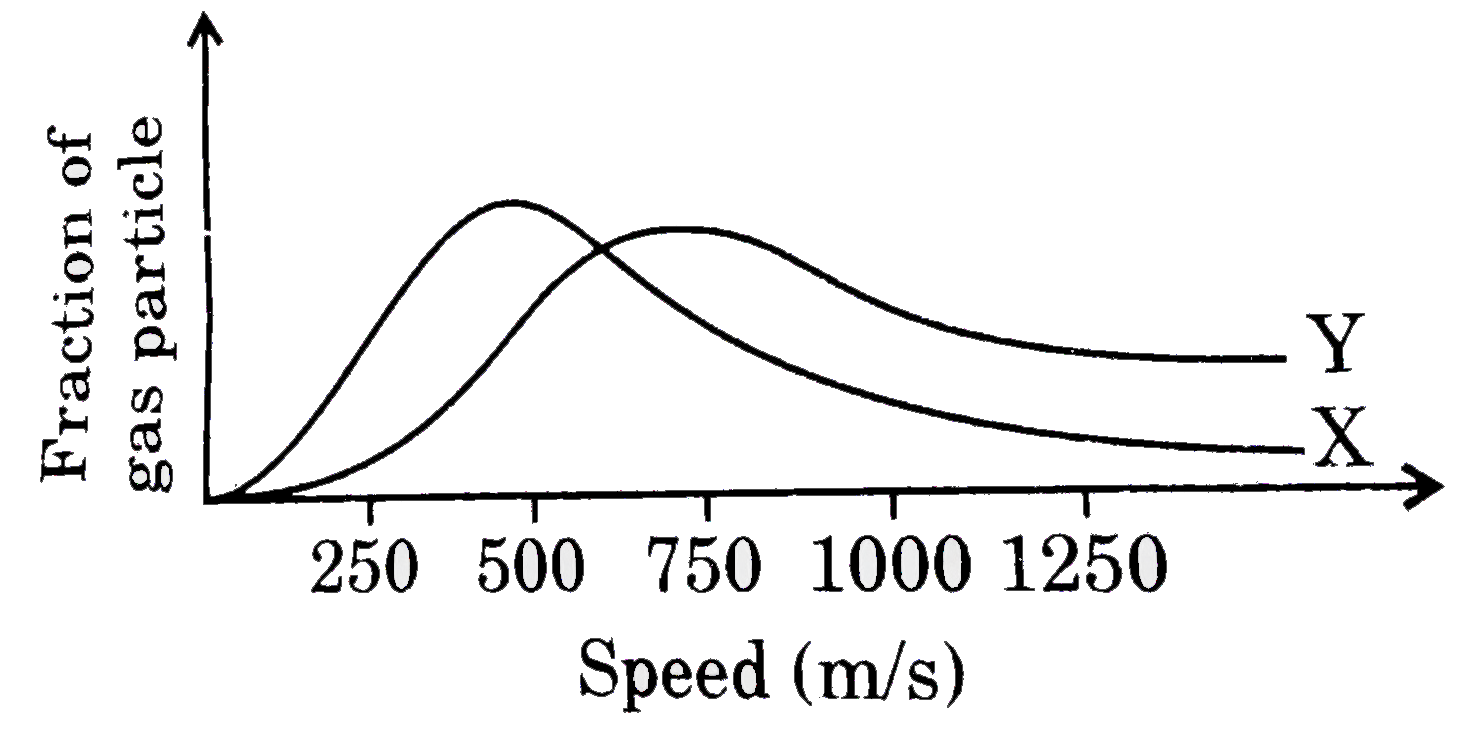
- The graph below shows the distribution of molecular speeds of two idea...
Text Solution
|
- The graph given below shows the P-V plot for a process on an ideal gas...
Text Solution
|
- The graphs representing distribution of molecular speeds at 300 K for ...
Text Solution
|
- The graph below shows the distribution of molecular speeds of two idea...
Text Solution
|
- Which of the following graphs regarding Maxwell distribution of speed ...
Text Solution
|
- The graph of (y-x) against (y+x) is shown below. Which one of the...
Text Solution
|
- The graph of y = f(x) is given below then the graph y = |f(|x|)| ...
Text Solution
|
- Explain Maxwell distribution of molecular speed with necessary graph.
Text Solution
|
- The graphs representing distribution of molecular speeds at 300 K for ...
Text Solution
|