


Similar Questions
Explore conceptually related problems
Recommended Questions
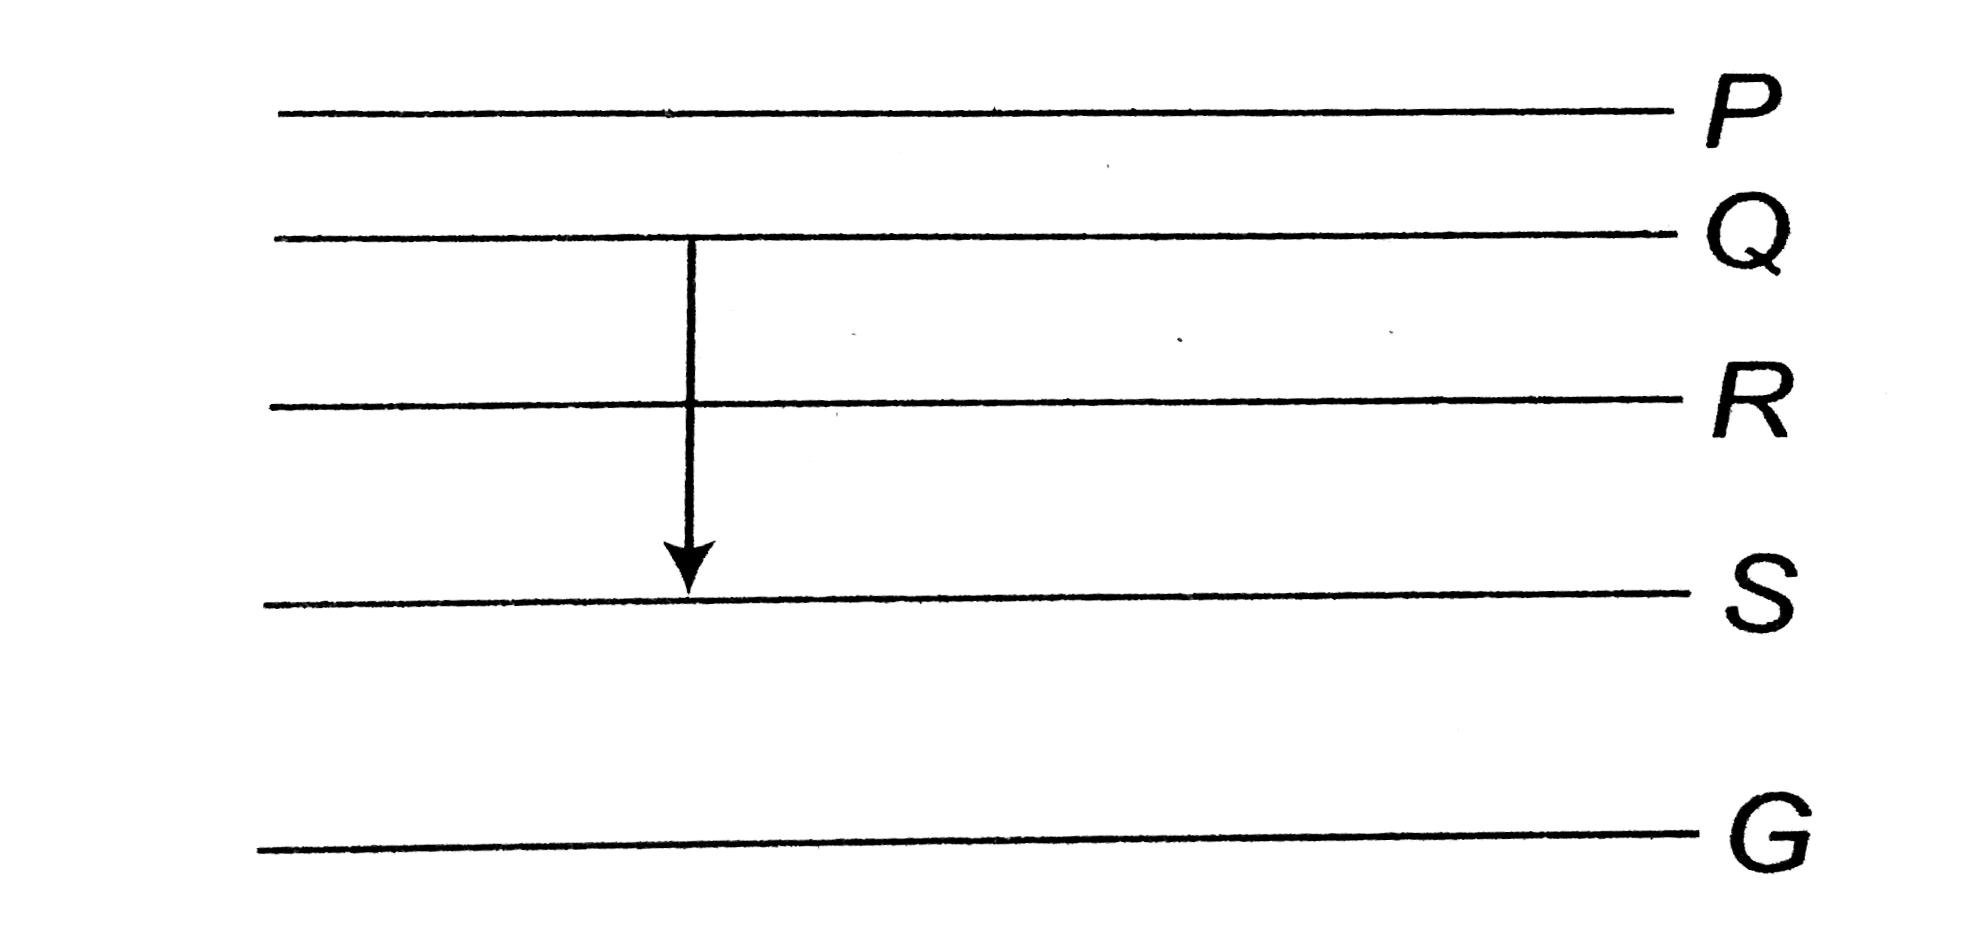
- Figure shows the enegry levels P, Q, R, S and G of an atom where G is ...
Text Solution
|
- Figure shows the enegry levels P, Q, R, S and G of an atom where G is ...
Text Solution
|
- The figure indicates the enegry level diagram of an atom and the origi...
Text Solution
|
- An atom has x energy level , then total number of lines in its spectru...
Text Solution
|
- Total different spectral lines observed in between 11th excited state ...
Text Solution
|
- हाइड्रोजन परमाणु nवे ऊर्जा-स्तर में उत्तेजित अवस्था में है। उत्सर्जन स...
Text Solution
|
- मूल ऊर्जा स्तर में हाइड्रोजन परमाणु को एकवर्णीय विकिरण तरंगदैर्घ्य lam...
Text Solution
|
- A spectral line obtained when an electron jumps from sixth energy leve...
Text Solution
|
- How many lines can be found in the hydrogen spectrum if the electrons ...
Text Solution
|