


Similar Questions
Explore conceptually related problems
Recommended Questions
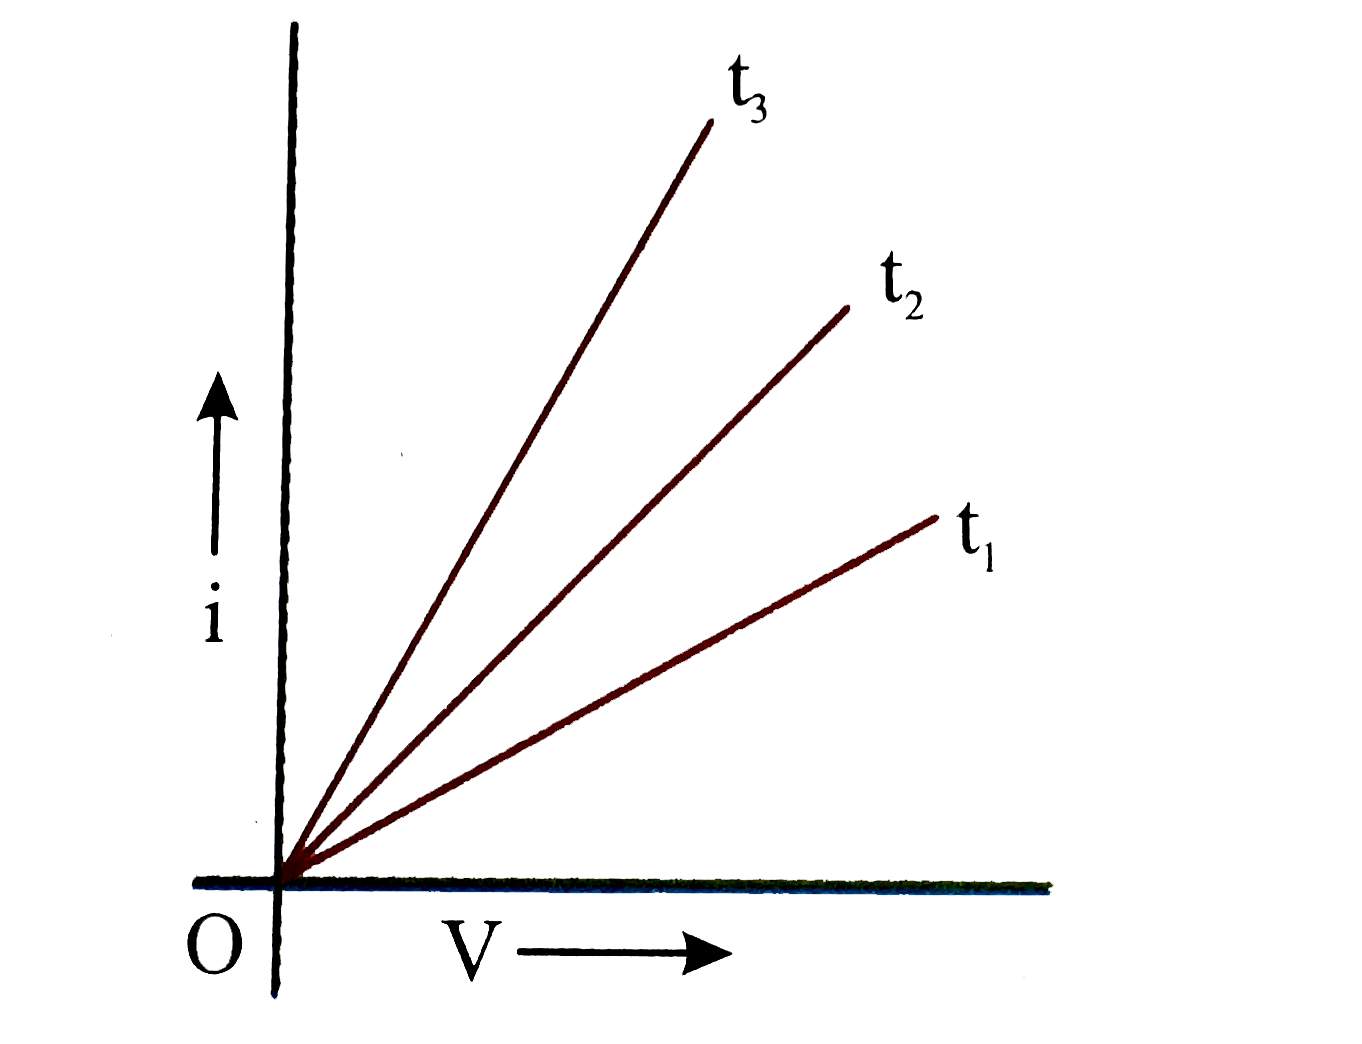
- V-i graphs of anichrome wire at three different temeperatures t(1), t(...
Text Solution
|
- V- I graph for a metallic wire at two different temperature T(1) and T...
Text Solution
|
- V-i graphs of anichrome wire at three different temeperatures t(1), t(...
Text Solution
|
- The current (I) and voltage (V) graphs for a given metallic wire at tw...
Text Solution
|
- The voltage V and current I graph for a conductor at two different tem...
Text Solution
|
- The V - i graph for a conductor at temperature T(1) and T(2) are as sh...
Text Solution
|
- I,II,III are three isotherms respectively at T(1),T(2) and T(3) for a ...
Text Solution
|
- The voltage V and current I v graphs for a conductor at two different ...
Text Solution
|
- The stress-strain graph for a metallic wire is shown at two different ...
Text Solution
|