Home
Class 11
ECONOMICS
We have the following data on the monthl...

We have the following data on the monthly expenditure on food (in rupees) for 30 households in a locality.

(i) Obtain a frequency distribution using following class intervals:
100-150, 150-200, 200-250, 250-300, 300-350
(ii) What percentage of households spends less than Rupees 250 per month and what percentage of households spends more than Rupess 200 per month?

Promotional Banner

Similar Questions

Explore conceptually related problems

Find the median of the following data: Classes: 0-50 50-100 100-150 150-200 200-250 250-300 300-350 Frequency: 2 3 5 6 5 3 1

The table below shows the daily expenditure on food of 25 households in a locality . {:("Daily expenditure (Rs)" ,"Number of households"),(100-150,4),(150-200,5),(200-250,12),(250-300,2),(300-350,2):} Find the mean of expenditure on food of households in a locality .

The table below shows the daily expenditure on food of 25 households in a locality. daily expenditure(in rs) 100-150 150-200 200-250 250-300 300-350 no. of households 4 5 12 2 2 Find the mean daily expenditure on food by a suitable method.

The table below shows the daily expenditure on food of 25 households in a locality. {:("Dail expenditure (in Rs)",100-150,150-200 , 200 - 250 , 250 -300,300-350),("Number of households",4,5,12,2,2):} Find the mean daily expenditure on food by suitable method.

The following table gives the distribution of total household expenditure (in rupees) of manual workers in a city. Expenditure (in rupees) (x_i) Frequency (f_i) 100-150 24 150-200 40 200-250 33 250-300 28 300-350 30 350-450 22 400-450 16 450-500 7 Find the average expenditure (in rupees) per household.

The following table gives the distribution of total household expenditure (in rupees) of manual workers in a city. Expenditure (in rupees) (x_i) Frequency (f_i) 100-150 24 150-200 40 200-250 33 250-300 28 300-350 30 350-450 22 400-450 16 450-500 7 Find the average expenditure (in rupees) per household.

The following table gives the distribution of total household expenditure (in rupees) of manual workers in a city. Expenditure: (in Rs.) 100-150 150-200 200-250 250-300 300-350 350-400 400-450 450-500 Frequency: 24 40 33 28 30 22 16 7 Find the average expenditure (in Rs.) per household.

The following table gives the distribution of total household expenditure (in rupees) of manual workers in a city. Expenditure: (in Rs.) 100-150 150-200 200-250 250-300 300-350 350-400 400-450 450-500 Frequency: 24 40 33 28 30 22 16 7 Find the average expenditure (in Rs.) per household.

The monthly profits (in Rs.) of 100 shops are distributed as follows: Profits per shop: 0-50 50-100 100-150 150-200 200-250 250-300 No. of shops: 12 18 27 20 17 6 Draw the frequency polygon for it.

Recommended Questions
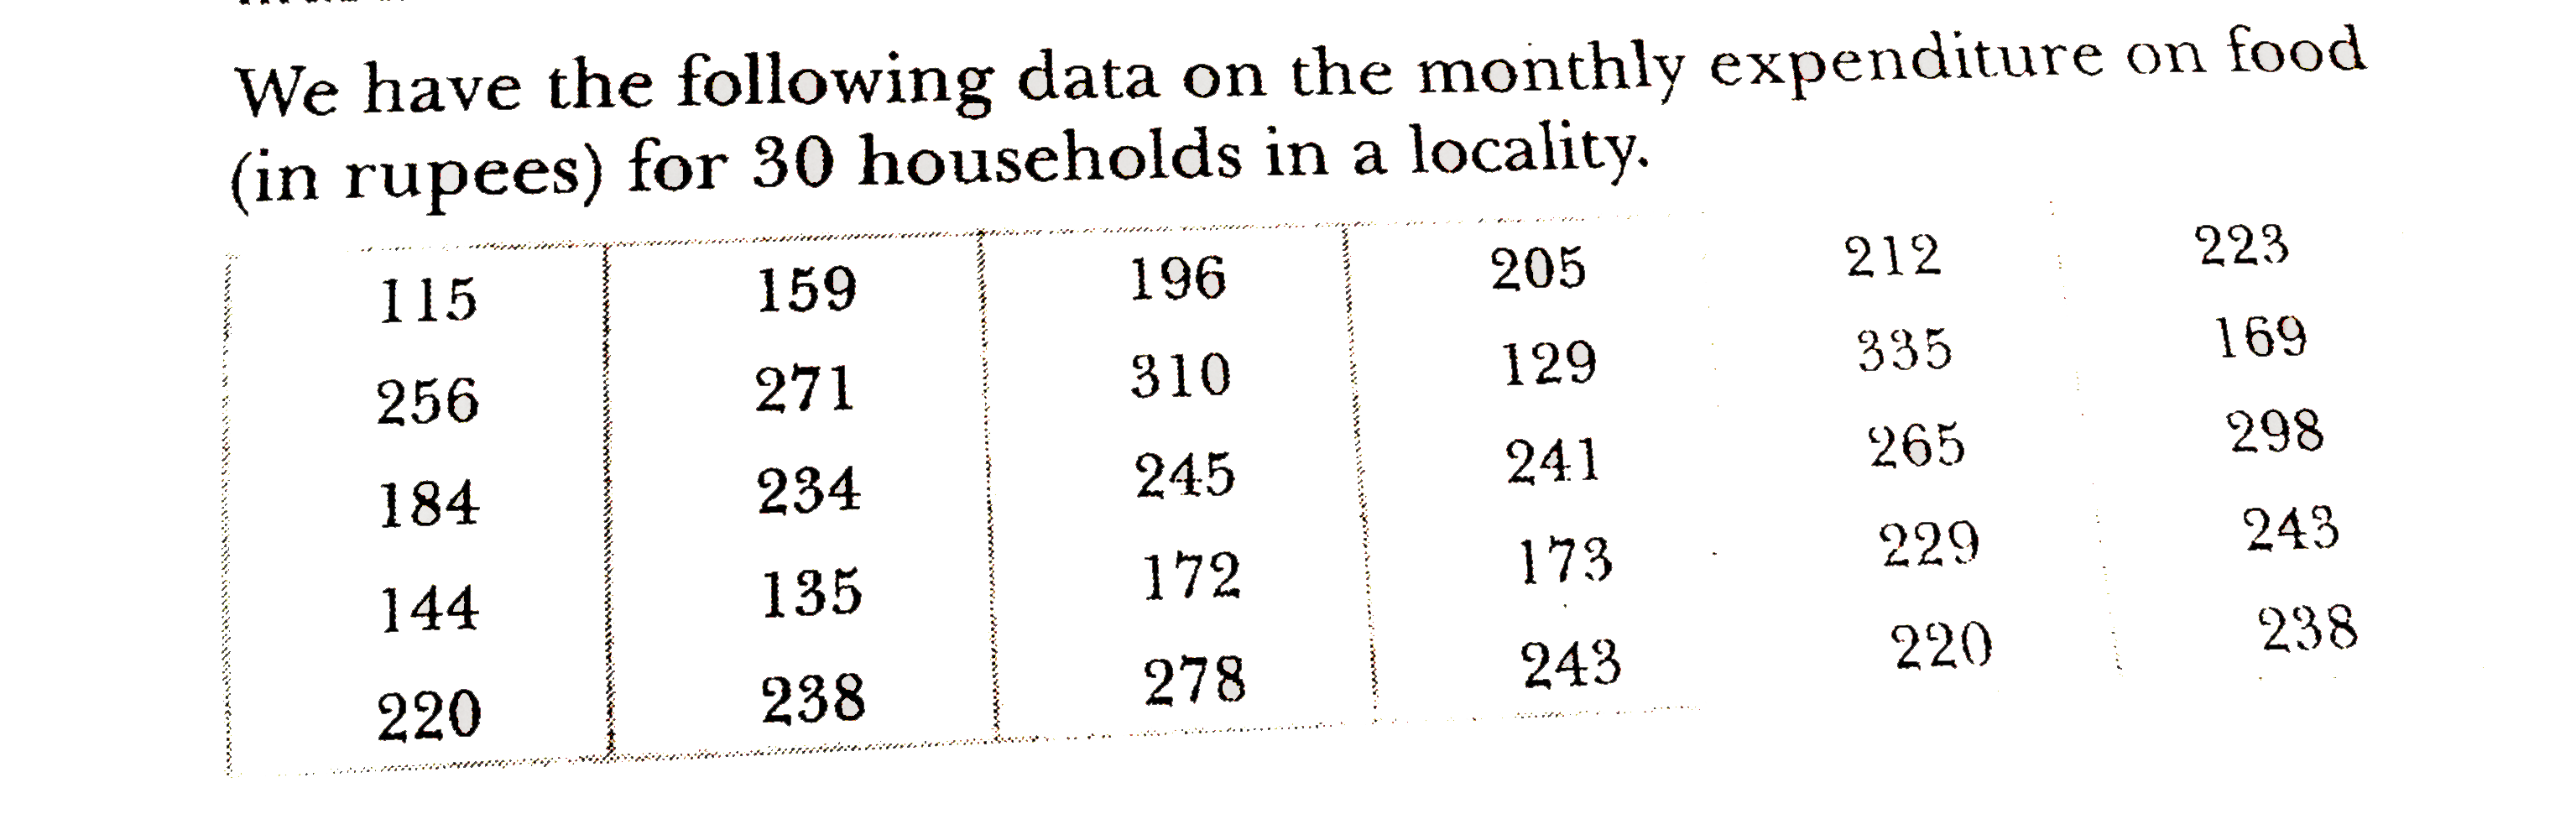
  1. We have the following data on the monthly expenditure on food (in rupe...

    Text Solution

    |

  2. निम्नलिखित पर संक्षिप्त टिप्पणी लिखिए- (i ) डार्जेन अभिक्रिया , ...

    Text Solution

    |

  3. निम्नलिखित पर संक्षिप्त टिप्पणी लिखिए- (i ) आयोडोफॉर्म परीक्षण । ...

    Text Solution

    |

  4. किसी फिलामेन्ट का 100^(@)C पर प्रतिरोध 100 ओम तथा 400^(@)C पर 2...

    Text Solution

    |

  5. 1.5 वोल्ट का एक आदर्श सेल 100 Omega तथा 200 Omega के प्रतिरोधों क...

    Text Solution

    |

  6. 0.40 टेस्ला के चुम्बकीय क्षेत्र के अंतर्गत एक कण 1.0 सेमी व्यास के वृत...

    Text Solution

    |

  7. एक कक्षा के छात्रों को पंक्ति में खड़ा किया जाता है। यदि प्रत्येक पंक्...

    Text Solution

    |

  8. एक छात्रावास के मासिक व्यय का एक भाग नियत है तथा शेष इस पर निर्भर करता...

    Text Solution

    |

  9. समस्याओ में रैखिक समीकरणो के युग्म बनाइए और अनके हल ( यदि उनक...

    Text Solution

    |