Text Solution
Verified by Experts


Similar Questions
Explore conceptually related problems
Recommended Questions
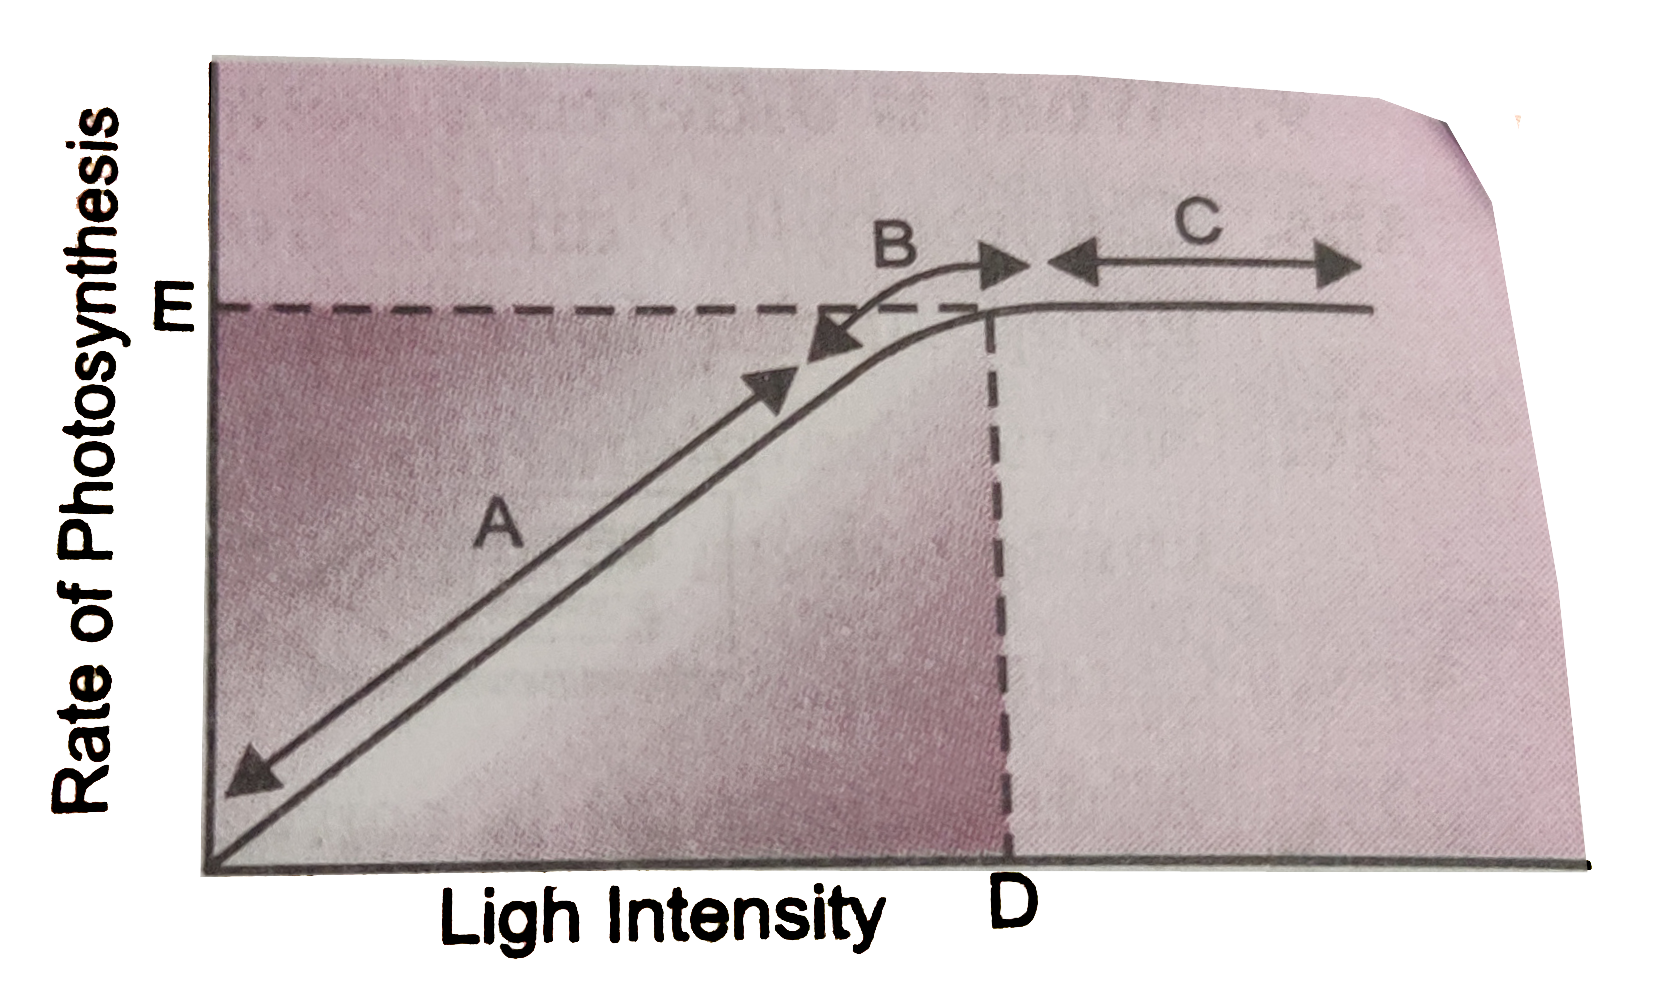
- Figure shows, the effect of light on the rate of photosynthesis Based ...
Text Solution
|
- प्रकाश-संश्लेषण की दर पर प्रकाश का प्रभाव पड़ता है ग्राफ के आधार पर नि...
Text Solution
|
- Figure shows the effect of light on the rate of photosynthesis. Based ...
Text Solution
|
- The figure shows the effect of light on the rate of photosynthesis. Ba...
Text Solution
|
- The figure shows the effect of light on the rate of photosynthesis. Ba...
Text Solution
|
- Figure given below shows the effect of light on the role of photosynth...
Text Solution
|
- Figure 13.10 shows the effect of light on the rate of photosynthesis. ...
Text Solution
|
- Figure 13.10 shows the effect of light on the rate of photosynthesis. ...
Text Solution
|
- Figure 13.10 shows the effect of light on the rate of photosynthesis. ...
Text Solution
|