Text Solution
Verified by Experts


Similar Questions
Explore conceptually related problems
Recommended Questions
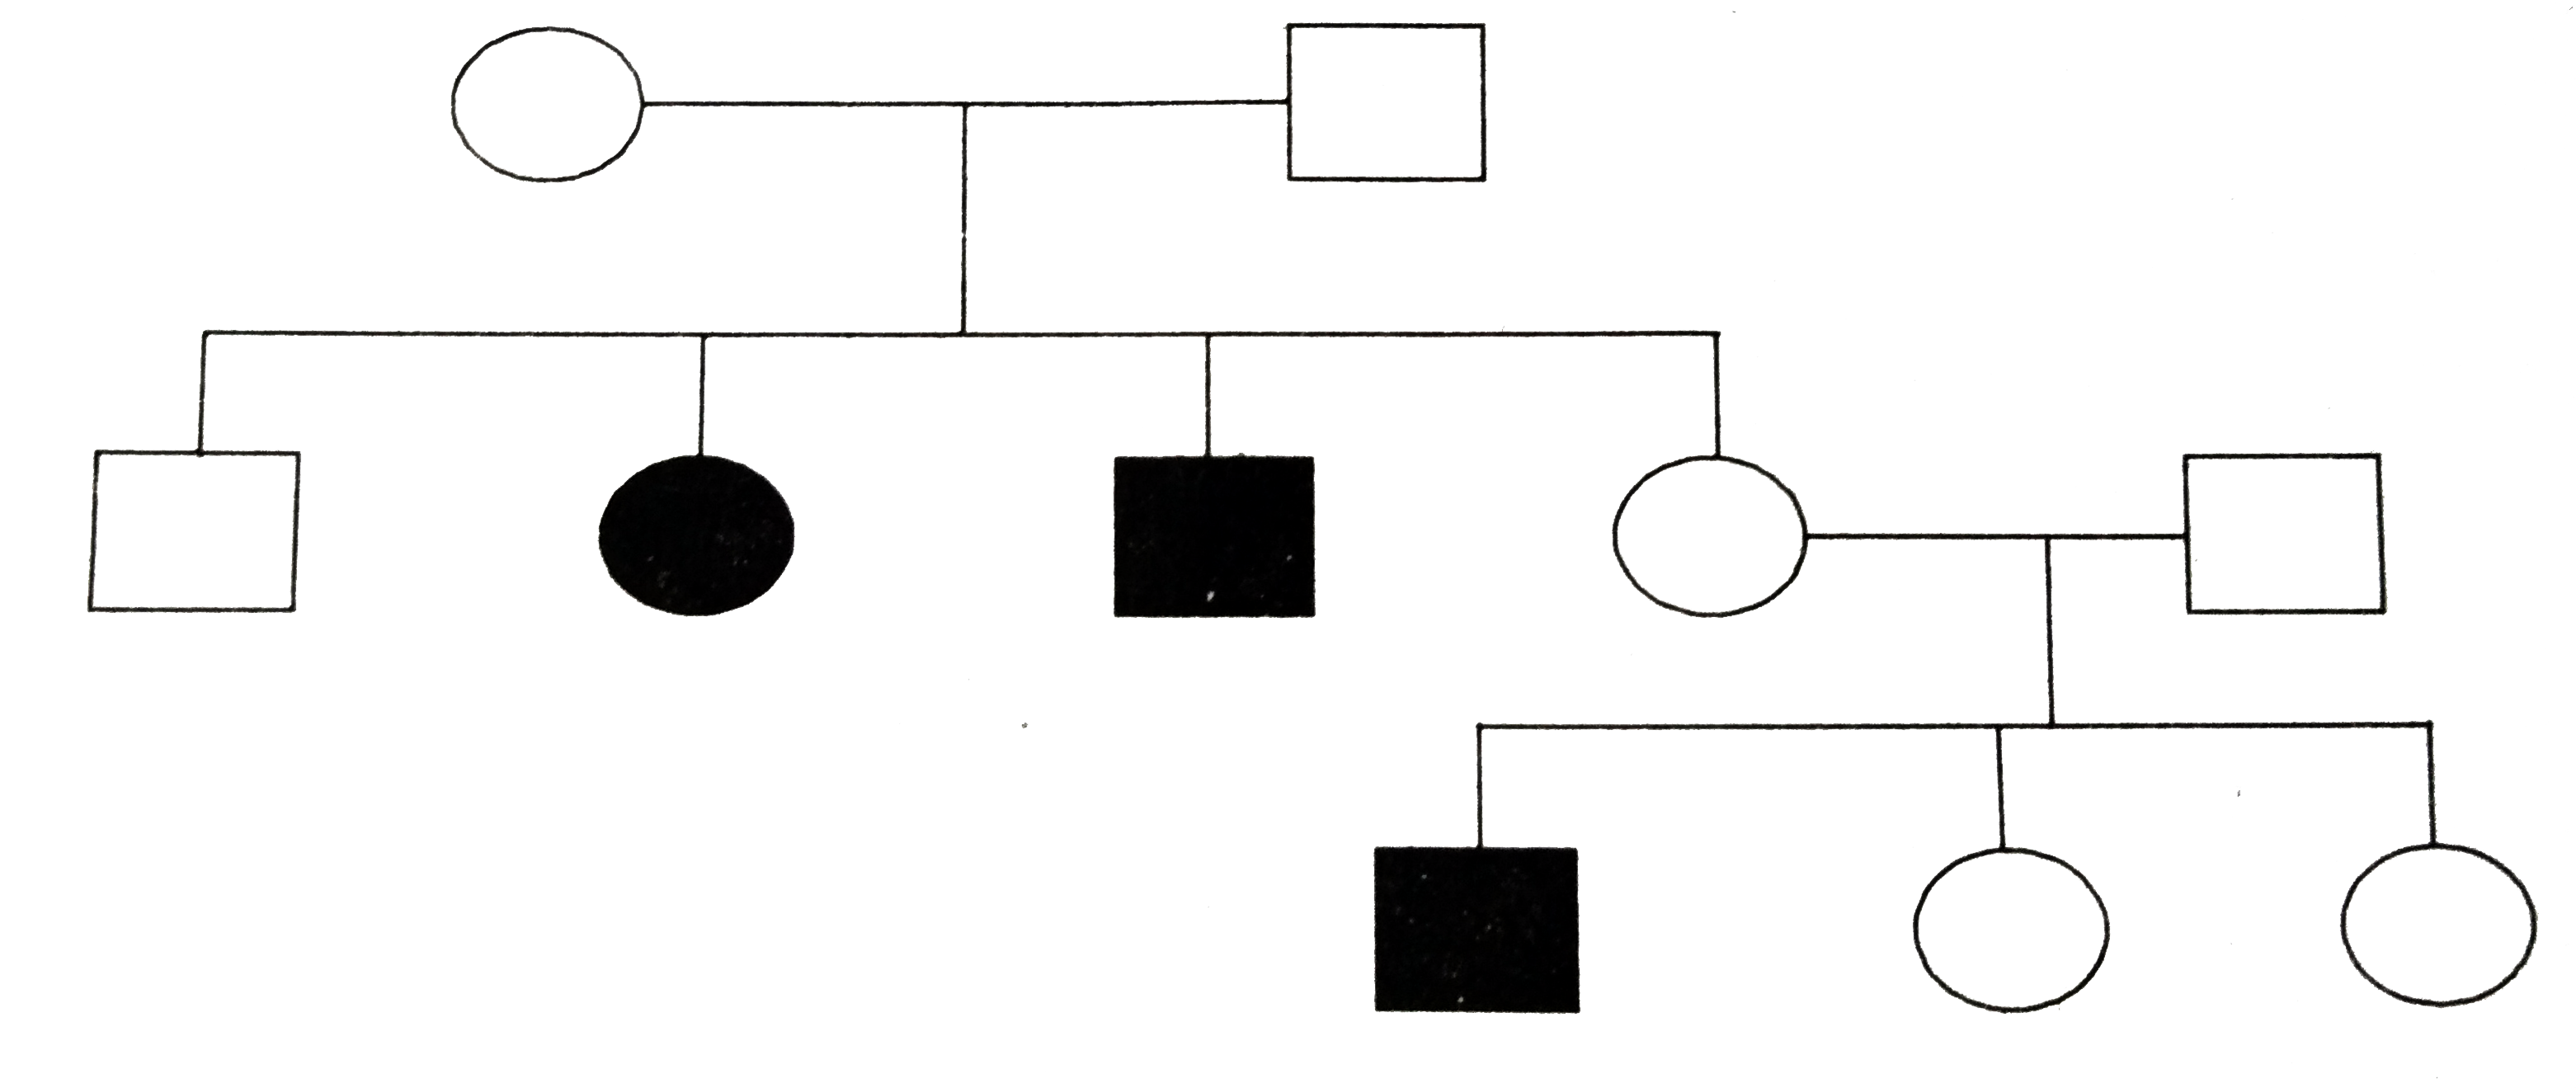
- Study the given pedigree chart and answer the queation that follow. ...
Text Solution
|
- Study the given pedigree chart and answer the queation that follow. ...
Text Solution
|
- Study the given pedigree chart and answer the queation that follow. (a...
Text Solution
|
- In the following pedigree chart, state if the trait is autosomal domin...
Text Solution
|
- Study the given pedigree chart and answer the questions that follow. ...
Text Solution
|
- Study the given pedigree chart and answer the questions that follow. I...
Text Solution
|
- Study the given pedigree chart and answer the queation that follow. ...
Text Solution
|
- Study the given pedigree chart and answer the question that follow. (a...
Text Solution
|
- Study the given pedigree chart and answer the queation that follow. ...
Text Solution
|