


Similar Questions
Explore conceptually related problems
Recommended Questions
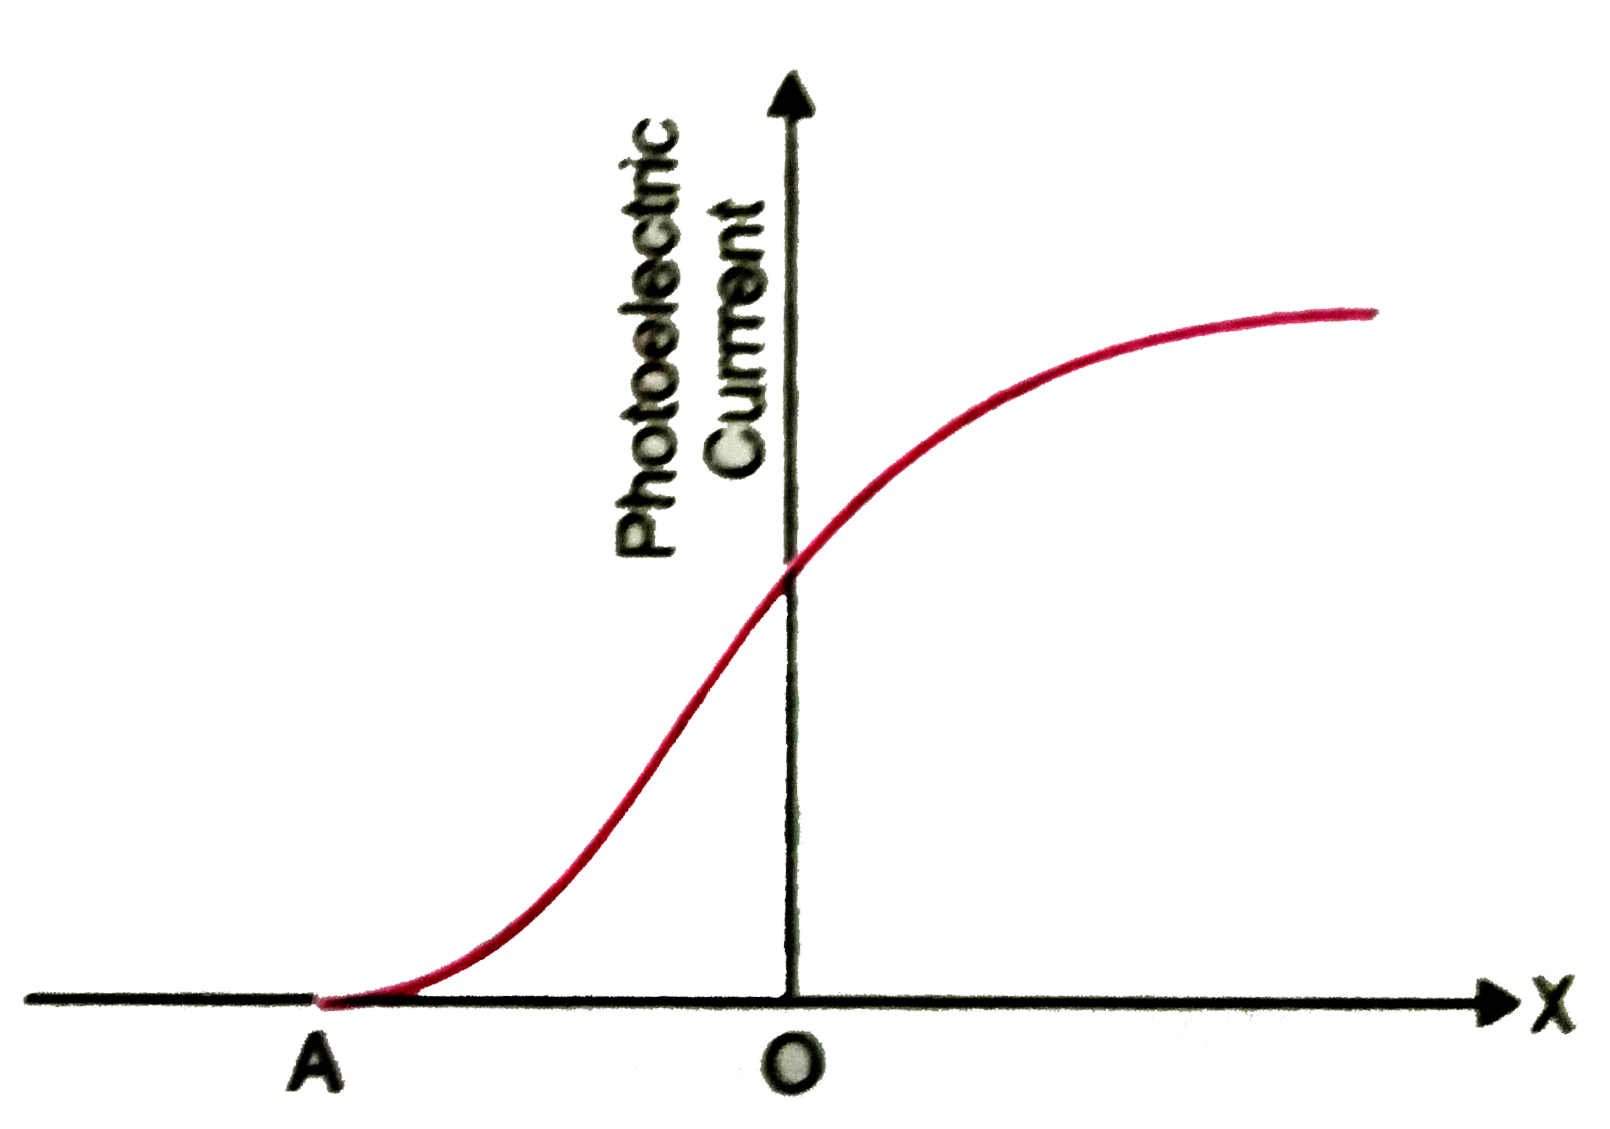
- The following graph shows the variation of photoelectric current for a...
Text Solution
|
- Draw a graph showing the variation of stopping potential with frequenc...
Text Solution
|
- The graph of Fig. shows the variation of photoelectric current with co...
Text Solution
|
- The Fig shows a plot of three curves a, b, c showing the variation of ...
Text Solution
|
- Draw a plot showing the variation of photoelectric current with collec...
Text Solution
|
- The following graph shows the variation of photoelectric current for a...
Text Solution
|
- Draw graphs showing variation of photoelectric current with applied vo...
Text Solution
|
- प्रकाश संवेदी सतह पर आपतित विकिरण की तीव्रता के साथ प्रकाश-विद्युत धार...
Text Solution
|
- Draw a graph showing variation of photoelectric current (I) with anode...
Text Solution
|