


Similar Questions
Explore conceptually related problems
Recommended Questions
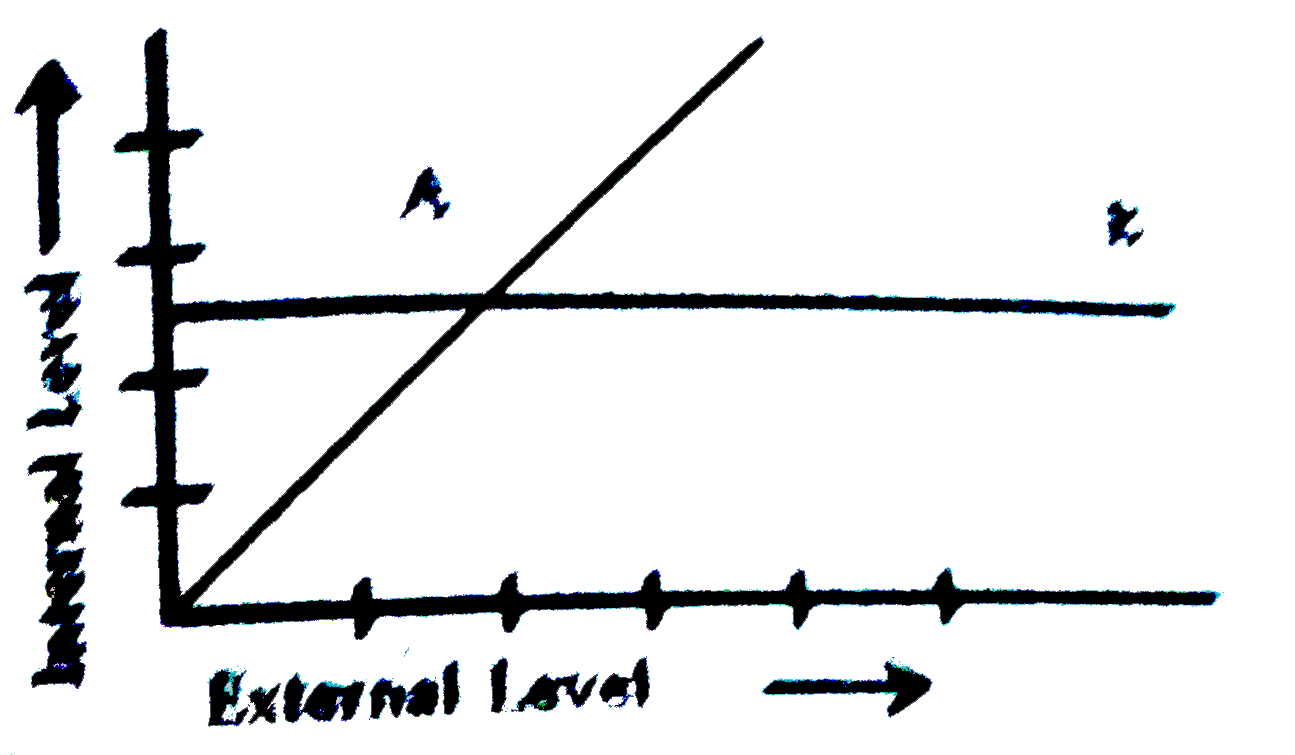
- (a) The graph given below represents the organisms response to temper...
Text Solution
|
- The graph given below represents changes in different ecological param...
Text Solution
|
- (a) The graph given below represents the organisms response to tempera...
Text Solution
|
- The graph given below represents the organisms reponse to temperature ...
Text Solution
|
- Which of the following graphs represent the function of x ? Why
Text Solution
|
- (a) The graph given below represents the organisms response to temper...
Text Solution
|
- The graph given below represents changes in different ecological param...
Text Solution
|
- The figure given below represents response of organisms to abiotic fac...
Text Solution
|
- The diagrams, given below, represent two inequations A and B on real n...
Text Solution
|