


Similar Questions
Explore conceptually related problems
Recommended Questions
- The temperature dependence of the rate constant k is expressed as k = ...
Text Solution
|
- Assertion (A) : k=Ae^(-E(a)//RT) , the Arrhenius equation represents t...
Text Solution
|
- The temperature dependence of the rate of a chemical reaction is given...
Text Solution
|
- The temperature dependence of the rate constant k is expressed as k = ...
Text Solution
|
- Rate constant k of a reaction is dependent on temperatur: k=Ae^(Ea//...
Text Solution
|
- Rate constant k of a reactionn is dependent on temperature k=Ae^(-E(a)...
Text Solution
|
- At constant temperature if a graph plotted between logP and log((1)/(V...
Text Solution
|
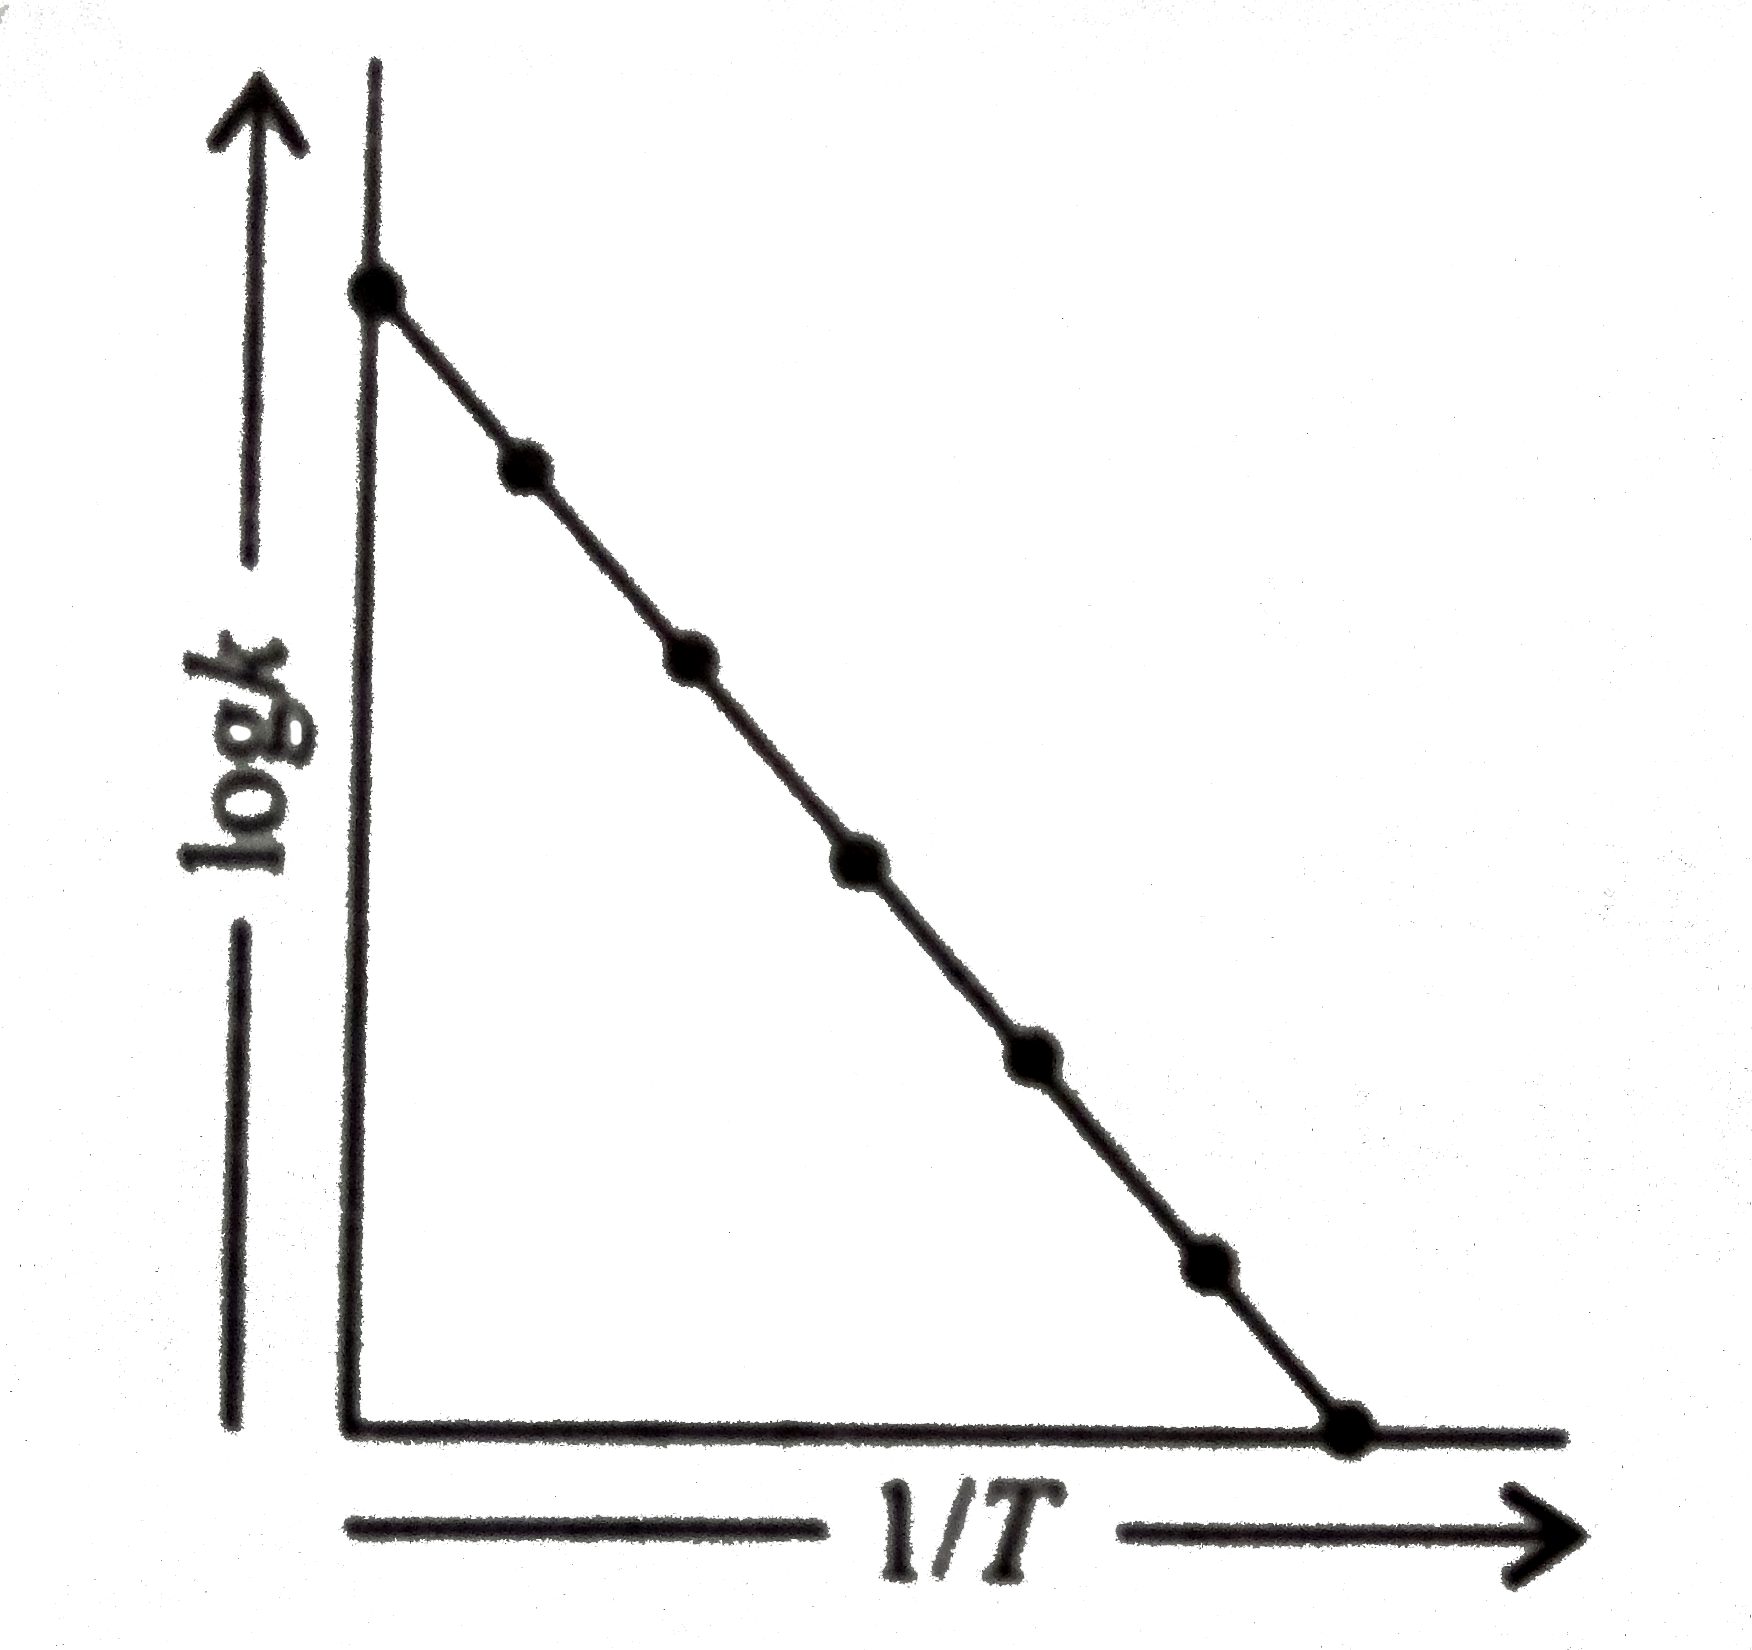
- When a plot between logk and 1/T is plotted we get the graph as shown....
Text Solution
|
- In Arrehenius equation if a graph is plotted between logK and 1/T, the...
Text Solution
|