


Similar Questions
Explore conceptually related problems
Recommended Questions
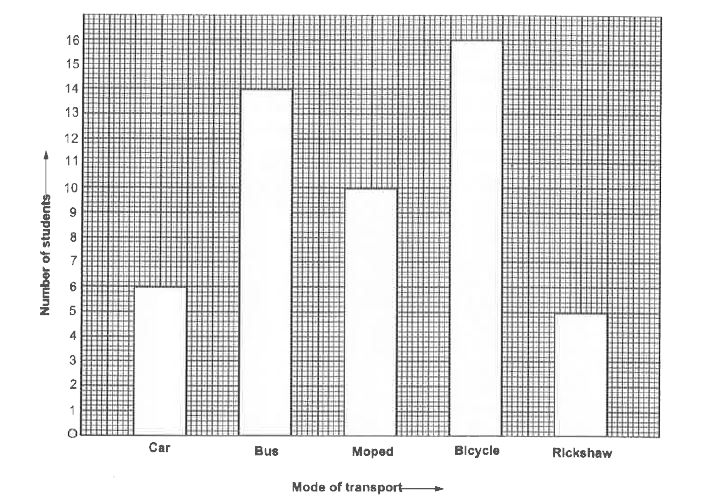
- 51 students from a locality use different modes of transport to school...
Text Solution
|
- The histogram shows the number of students using different modes of tr...
Text Solution
|
- The histogram shows the number of students using different modes of tr...
Text Solution
|
- The histogram shows the number of students using different modes of tr...
Text Solution
|
- The inequation represented by the graph given below is : <img src="htt...
Text Solution
|
- The inequation that best describes the graph given below is <img src=...
Text Solution
|
- In the given figure, PQRS is a parallelogram. A and B are the mid-poin...
Text Solution
|
- 70 students from a locality use different modes of transport to go to ...
Text Solution
|
- नीचे एक सोसाइटी के 70 विधाथियों द्वारा स्कूल जाने के लिए , प्रयोग किए ...
Text Solution
|