


Similar Questions
Explore conceptually related problems
Recommended Questions
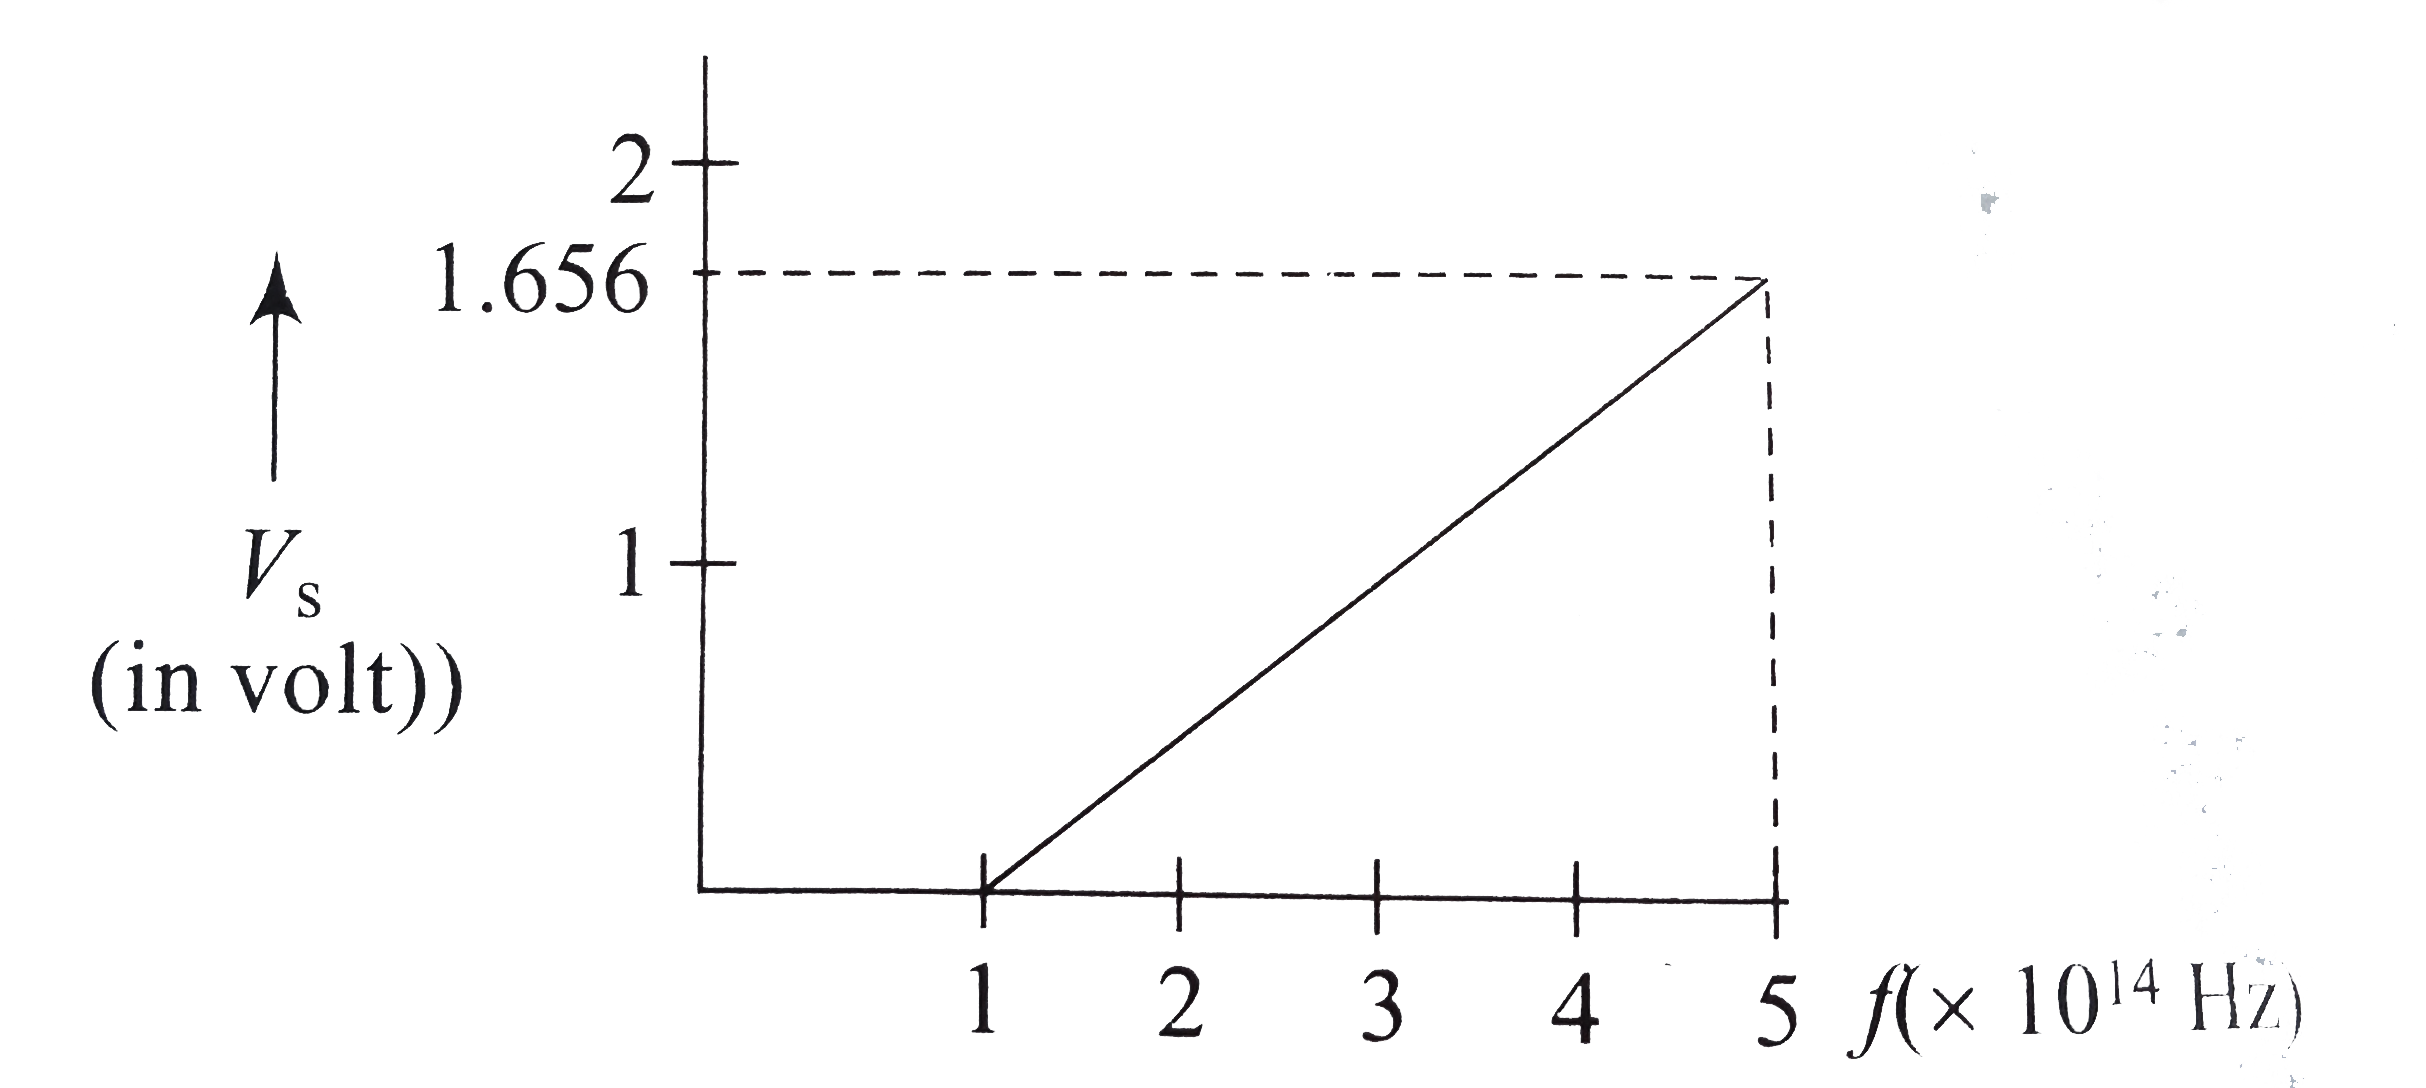
- Figure shows the plot of the stopping potential versus the frequency o...
Text Solution
|
- Figure is the plot of the stopping potential versus the frequency of t...
Text Solution
|
- Figure shows the plot of the stopping potential versus the frequency o...
Text Solution
|
- In an experiment on photoelectric effect the frequency f of the incide...
Text Solution
|
- If the frequency of light in a photoelectric experiment is doubled the...
Text Solution
|
- A non-monochromatic light is used in an experiment on photoelectric ef...
Text Solution
|
- The slope of the stopping potential versus frequency graph for photoel...
Text Solution
|
- For photoelectric effect in sodium, the figure shows the plot of cut-o...
Text Solution
|
- In an experiment on photoelectric effect the frequency f of the incide...
Text Solution
|