


Similar Questions
Explore conceptually related problems
Recommended Questions
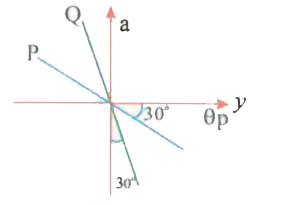
- The acceleration-displacement graph of two particles P and Q exeucting...
Text Solution
|
- The relation between the acceleration a and displacement x of a partic...
Text Solution
|
- The acceleration versus displacement graph of a particle performing SH...
Text Solution
|
- Acceleration-displacement graph of a particle executing SHM Is as show...
Text Solution
|
- Two particles P and Q are moving as shown in the figure. At this momen...
Text Solution
|
- The position-time graph for two particles P and Q moving on x-axis is ...
Text Solution
|
- एक सरल आवर्त गति करने वाले किसी कण के त्वरण (a) तथा विस्थापन (y) का सम...
Text Solution
|
- सरल आवर्त गति करने वाले किसी कण के त्वरण (a ) तथा विस्थापन (y ) का ...
Text Solution
|
- Displacement-time graph of a particle moving in a straight line is as ...
Text Solution
|