Text Solution
Verified by Experts
The correct Answer is:


Topper's Solved these Questions
MODEL QUESTION PAPER 3[UNSOLVED]
VK GLOBAL PUBLICATION|Exercise SECTION B|6 VideosMODEL QUESTION PAPER 3[UNSOLVED]
VK GLOBAL PUBLICATION|Exercise SECTION C|10 VideosMODEL QUESTION PAPER -7
VK GLOBAL PUBLICATION|Exercise SECTION -D|8 VideosMODEL QUESTION PAPER 8 [UNSOLVED]
VK GLOBAL PUBLICATION|Exercise SECTION-D|7 Videos
Similar Questions
Explore conceptually related problems
VK GLOBAL PUBLICATION-MODEL QUESTION PAPER 3[UNSOLVED]-SECTION D
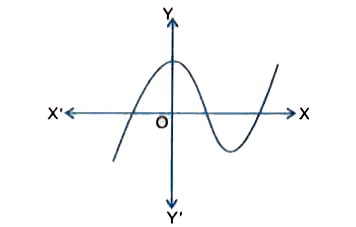
- The graph of y=f(x) is given in figure 1. What is the number of zeros ...
Text Solution
|
- A shopkeeper buys a number of books for Rs 1200. If he had bought 10 m...
Text Solution
|
- Prove that in a right triangle, the square of the hypotenuse is equal ...
Text Solution
|
- Draw a circle of radius 3 cm. Take two points P and Q on one of its ex...
Text Solution
|
- Anjali in an electrician and she has to repair an electric fault on a ...
Text Solution
|
- Prove that ( "cosec" A - sin A)(sec A- cos A)=(1)/((tan A+ cot A)).
Text Solution
|
- An elastic belt is placed around the rim of a pulley of radius 5 cm (F...
Text Solution
|
- A Right triangle whose sides are 15 cm and 20 cm; is made to revolve a...
Text Solution
|
- Find the mean of the following frequency distribution using assumed me...
Text Solution
|