


Topper's Solved these Questions
Similar Questions
Explore conceptually related problems
VK GLOBAL PUBLICATION-MODEL QUESTION PAPER -7 -SECTION -D
- Two types of water tankers are available in a shop. One is in cubic fo...
Text Solution
|
- A pole has to be erected at a point on the boundary of a circular p...
Text Solution
|
- Theorem 6.9 : In a triangle, if square of one side is equal to the sum...
Text Solution
|
- Draw a triangle ABC with side BC = 6 cm, AB = 5 cm and angleABC=60^@. ...
Text Solution
|
- Prove that:- (tan theta)/(1- cot theta) + (cot theta)/(1- tan theta) =...
Text Solution
|
- The angles of depression of the top and the bottom of an 8 m tall bui...
Text Solution
|
- From each corner of a square of side 4 cm a quadrant of a circle of...
Text Solution
|
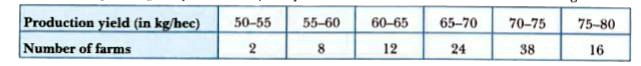
- The following table gives production yield per hectare of wheat of 100...
Text Solution
|