


Similar Questions
Explore conceptually related problems
Recommended Questions
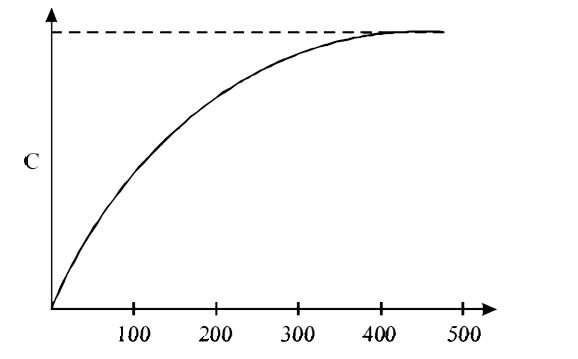
- The figure below shows the variation of specific heat capacity (C) of ...
Text Solution
|
- The figure below shows the variation of specific heat capacity (C) of ...
Text Solution
|
- Plots showing the variation of the rate constant (k) with temperature ...
Text Solution
|
- If specific ehat capacity of a substance in solid and liquid state is ...
Text Solution
|
- The specific heat of solids at low temperatures varies with absolute t...
Text Solution
|
- Plots showing the variation of the rate constant (k) with temperature ...
Text Solution
|
- Plots showing the variation of the rate constant (k) with temperature ...
Text Solution
|
- Plots showing the variation of the rate constant (k) with temperature ...
Text Solution
|
- The ratio of specific heat capacity at constant pressure to the specif...
Text Solution
|