


Similar Questions
Explore conceptually related problems
Recommended Questions
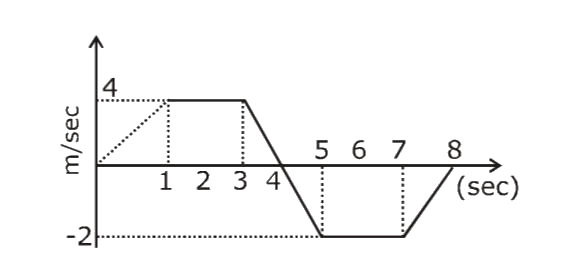
- The v-t graph of a linear motion is shown in adjoining figure. The dis...
Text Solution
|
- The velocity-time graph of a particle in straight line motion is veloi...
Text Solution
|
- The velocity-time graph of a linear motion os shown figure. The distan...
Text Solution
|
- The velocity time graph of a linear motion is shown in the figure. The...
Text Solution
|
- The velocity-time graph of a linear motion is shown in figure. The dis...
Text Solution
|
- The force-time( F – t ) curve of a particle executing linear motion is...
Text Solution
|
- The velocity-time graph of a linear motion is shown below. The distanc...
Text Solution
|
- The v - t graph for a particle is shown. The distance travelled in the...
Text Solution
|
- निम्न चित्र में , किसी रेखीय गति के लिए समय-दुरी ग्राफ दर्शाया गया है।...
Text Solution
|