Home
Class 11
ECONOMICS
From the following data, construct frequ...

From the following data, construct frequency histogram, frequency polygon and frequency curve.

Promotional Banner

Similar Questions

Explore conceptually related problems

For the following data, draw a histogram and a frequency polygon

For the following data, draw a frequency polygon .

Define bar graph, histogram, frequency polygon

Ages of 60 teachers in primary schools of a Mandal are given in the following frequency distribution table. Construct the Frequency polygon and frequency curve for the data without using the histogram. (Use separate graph sheets)

Weekly wages of 250 workers in a factory are given in the following table. Construct the histogram and frequency polygon on the same graph for the data given.

Show the following data by a frequency polygon.

Show the following data by a frequency polygon.

Show the following data by a frequency polygon .

Construction of two frequency polygon in same axes

Draw a histogram, a frequency polygon and frequency curve of the following data :

Recommended Questions
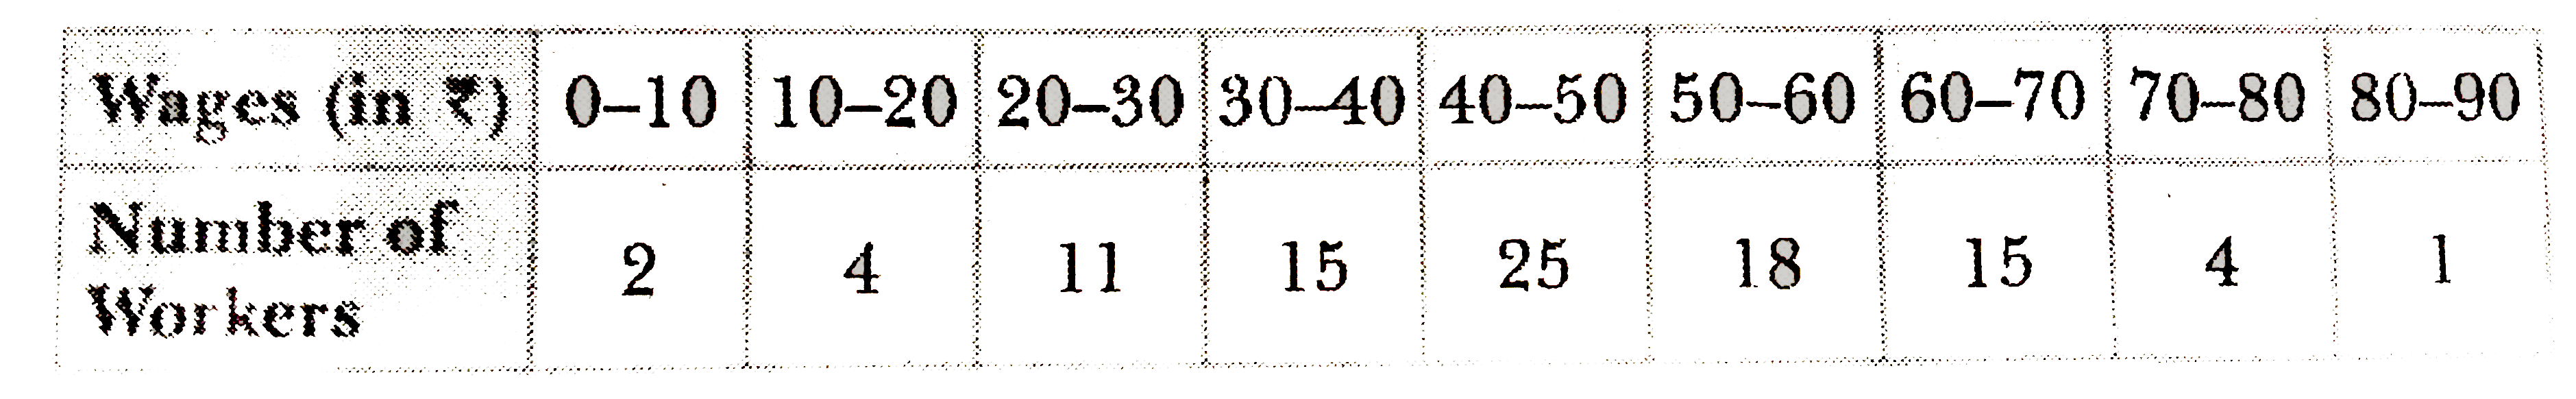
  1. From the following data, construct frequency histogram, frequency poly...

    Text Solution

    |

  2. क्लोरोफॉर्म को प्रकाश एवं वायु के प्रभाव से बचाने के लिए क्या सावधानि...

    Text Solution

    |

  3. निम्नलिखित में से किसकी अभिक्रिया से फॉस्फोरस से फोस्फीन बनायी जाती है...

    Text Solution

    |

  4. निम्नलिखित पदार्थों में से प्रतिचुम्बकीय तथा अनुचुम्बकीय पदार्थों को च...

    Text Solution

    |

  5. कोणीय आवृत्ति omega कि एक प्रत्यावर्ती वोल्टता को प्रतिरोध R , प...

    Text Solution

    |

  6. किसी प्रत्यावर्ती परिपथ में L ,C और R श्रेणीक्रम में जुड़े हैं ...

    Text Solution

    |

  7. विधुत अनुनाद किसे कहते हैं ? श्रेणी अनुनाद परिपथ कि सहयता से अन...

    Text Solution

    |

  8. अनुनादी आवृत्ति किसे कहते हैं ?

    Text Solution

    |

  9. A .C स्त्रोत की आवृत्ति में परिवर्तन के साथ संधारित्र प्रतिघात ...

    Text Solution

    |