


Similar Questions
Explore conceptually related problems
Recommended Questions
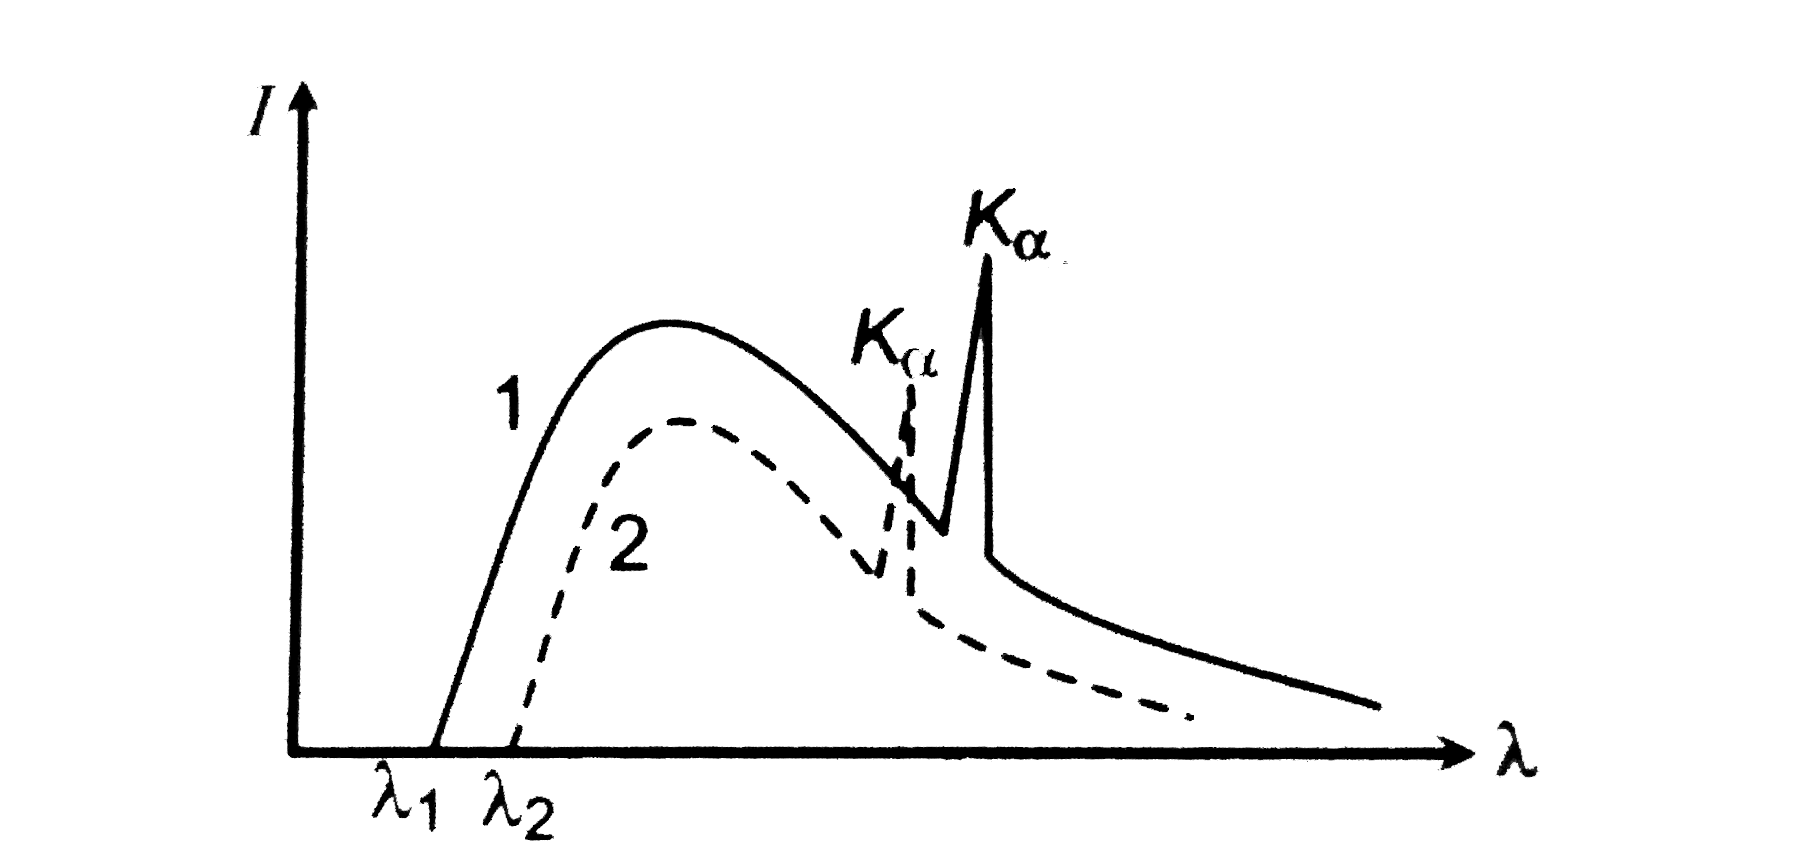
- The intensity distribution of X - rays from two Coolidge tubes operate...
Text Solution
|
- Three block 1, 2 and 3 are arranged as shown in the figure. The veloci...
Text Solution
|
- Figure shows intensity versus wavelength graph of X-rays coming from c...
Text Solution
|
- Figure shows intensity versus wavelength graph of X-rays coming from c...
Text Solution
|
- The intensity distribution of X - rays from two Coolidge tubes operate...
Text Solution
|
- The intensity of X - rays from a Coolidge tube is plotted against wave...
Text Solution
|
- Two capacitors C(1) and C(2) are connected in a circuit as shown in fi...
Text Solution
|
- When the voltage applied to and X-ray tube is increases from V(1)=10KV...
Text Solution
|
- Find the current in 10Omega resistcance, V(1) and source voltage V(s) ...
Text Solution
|