


Similar Questions
Explore conceptually related problems
Recommended Questions
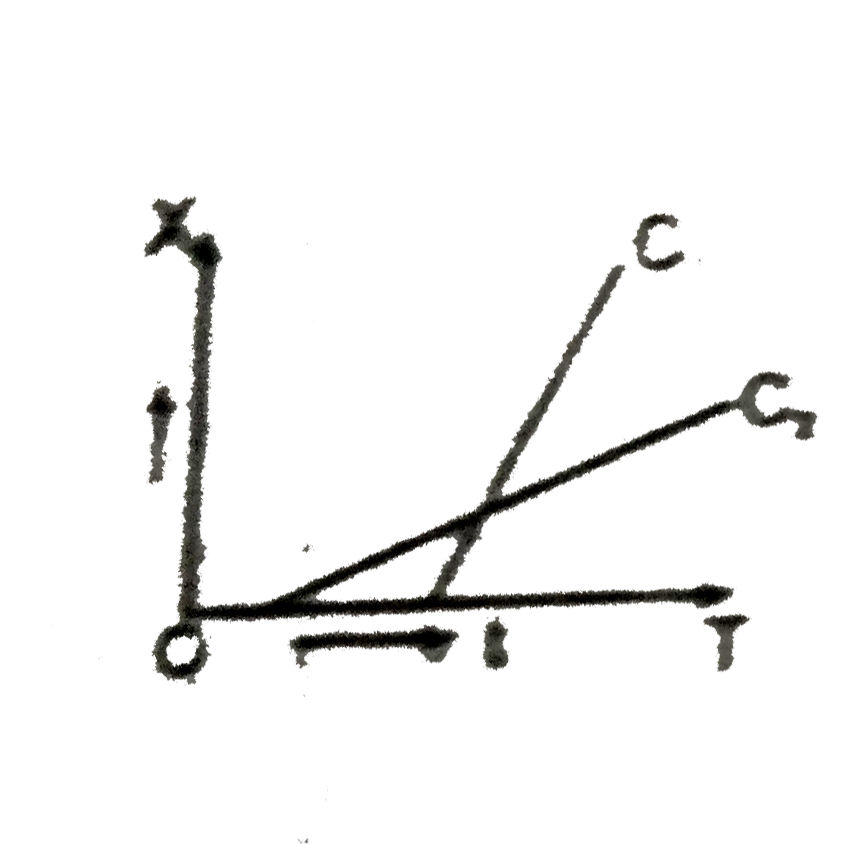
- Shown in the figure is the position-time graph for two chldren (C1 & C...
Text Solution
|
- The velocity-time graph of a particle in straight line motion is veloi...
Text Solution
|
- The velocity-time graph of a linear motion os shown figure. The distan...
Text Solution
|
- The velocity time graph of a linear motion is shown in the figure. The...
Text Solution
|
- Shown in the figure is the position-time graph for two chldren (C1 & C...
Text Solution
|
- In the figure two blocks are given velocities as shown. The lower bloc...
Text Solution
|
- Shown in the figure are the velocity time graphs of the two particle P...
Text Solution
|
- Shown in the figure are the velocity time graphs of the two particles ...
Text Solution
|
- Shown in the figure are the displacement time graph for two children g...
Text Solution
|