


Similar Questions
Explore conceptually related problems
Recommended Questions
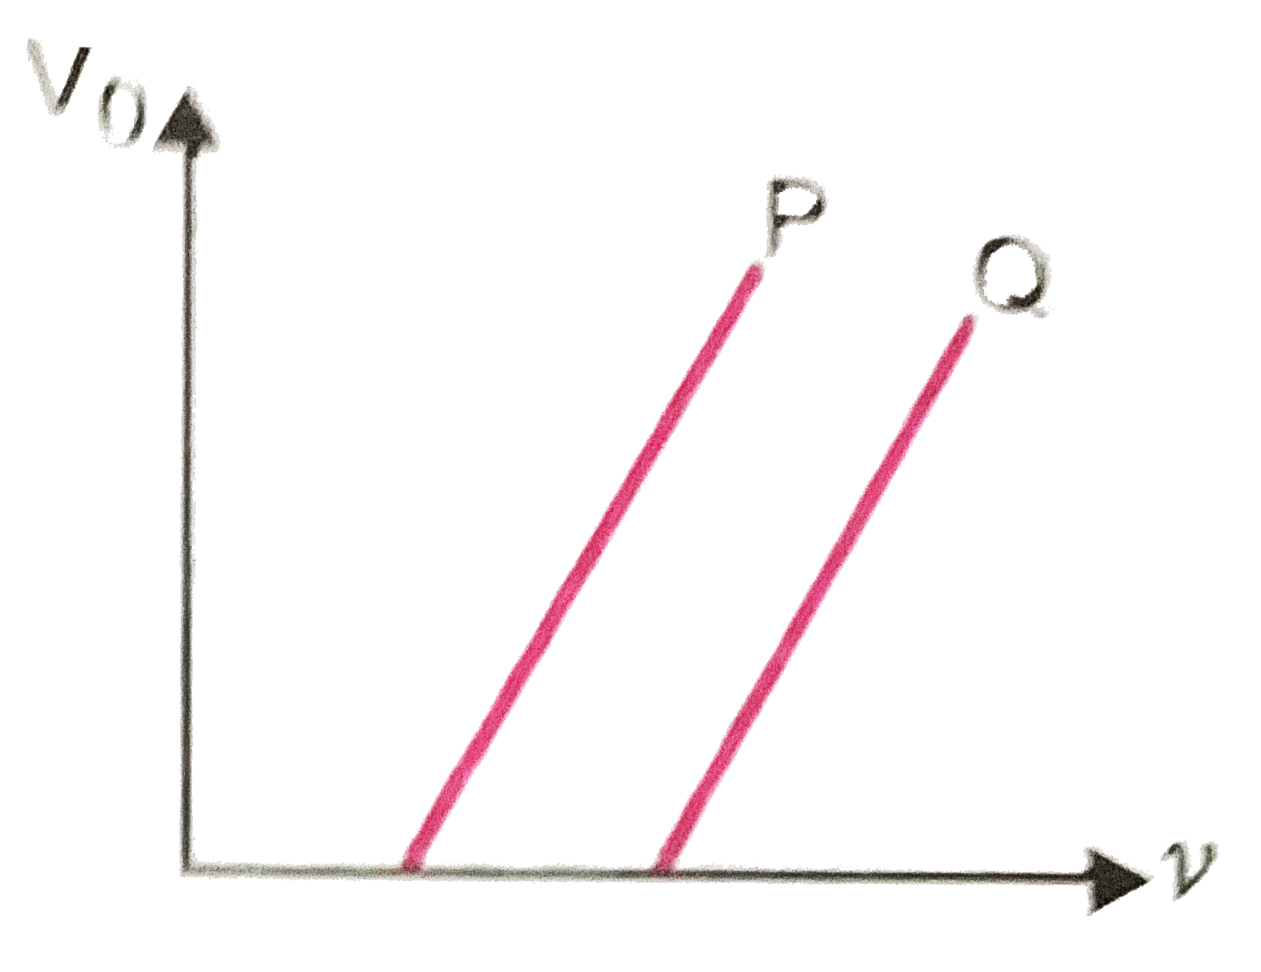
- Fig. shows the variation of stopping potential V0 with the frequency v...
Text Solution
|
- Fig. shows the variation of stopping potential V0 with the frequency v...
Text Solution
|
- In the study of a photoelectric effect the graph between the stopping ...
Text Solution
|
- The figure shows the variation of stopping potential V(Q) with the fre...
Text Solution
|
- दो प्रकाश सुग्राही धातुओ A व B के लिए आपतित विकिरण की आवृति V में परिव...
Text Solution
|
- The photoelectric threshold frequency of a metal is v0. When ligth of ...
Text Solution
|
- When radiation of the wavelength lamdais incident on a metallic surfac...
Text Solution
|
- The photoelectric threshold frequency of a metal is v. When light of f...
Text Solution
|
- The following graph shows the variation of stopping potential V0 with ...
Text Solution
|