A
B
C
D
Text Solution
Verified by Experts
The correct Answer is:


Topper's Solved these Questions
THERMODYNAMICS
MTG-WBJEE|Exercise WB JEE WORKOUT ( CATEGORY 2 : Single Option Correct Type (2 Mark )|15 VideosTHERMODYNAMICS
MTG-WBJEE|Exercise WB JEE WORKOUT ( CATEGORY 3 : One or Mare than One Option Correct Type (2 Mark )|10 VideosSOLID STATE ELECTRONS
MTG-WBJEE|Exercise WB JEE Previous Years Questions (CATEGORY 1 : Single Option Correct Type)|15 VideosWAVE OPTICS
MTG-WBJEE|Exercise WB JEE PREVIOUS YEARS QUESTION (MCQ.s)|9 Videos
Similar Questions
Explore conceptually related problems
MTG-WBJEE-THERMODYNAMICS-WB JEE Previous Years Questions
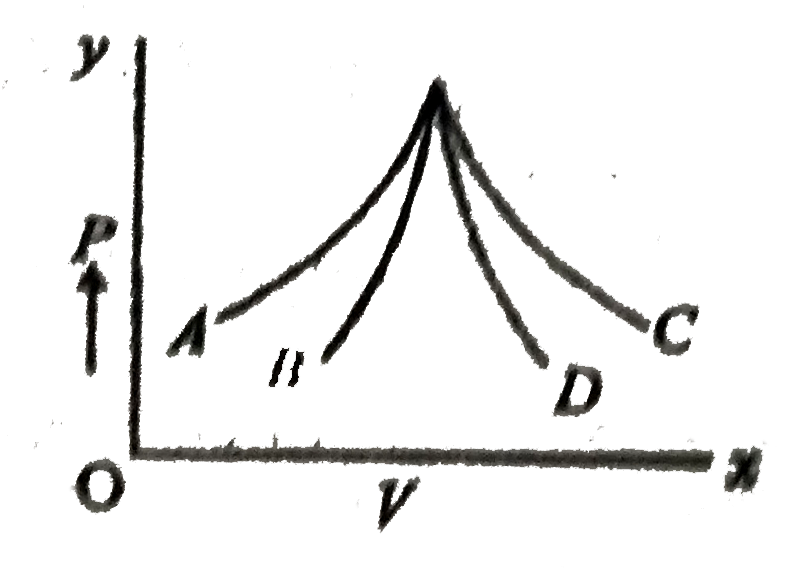
- Figure shows four PV diagrams. Which of these curves represent isother...
Text Solution
|
- A frictionless piston-cylinder based enclosure contains some amount of...
Text Solution
|
- An ideal monoatomic gas of given mass is heated at constant pressure. ...
Text Solution
|
- The specific heat c of a solid at low temperature shows temperature de...
Text Solution
|
- One mole of a van der Waals PA gas obeying the equation P (P + a/V^(2)...
Text Solution
|
- One mole of an ideal monoatomic gas is heated at a constant pressure o...
Text Solution
|
- 2 moles of ideal monatomic gas is carried from a state (P(0) , V(0)) ...
Text Solution
|
- One mole of a mono- atomic ideal gas undergoes a quasi- static process...
Text Solution
|
- For an ideal gas with initial pressure and volume P(i)" and " V(i), ...
Text Solution
|
- Consider the given diagram. An ideal gas is contained in a chamber (le...
Text Solution
|
- Pressure P, volume V and temperature T for a certain gas are related b...
Text Solution
|
- Which of the following statement(s) is/are true ? "Internal energy of ...
Text Solution
|
- The initial pressure and volume of a given mass of an ideal gas ("wit...
Text Solution
|