A
B
C
D
Text Solution
Verified by Experts
The correct Answer is:


Topper's Solved these Questions
SOLID STATE ELECTRONS
MTG-WBJEE|Exercise WB JEE WORKOUT (CATEGORY 3 : One or More than one option Correct Type)|10 VideosSOLID STATE ELECTRONS
MTG-WBJEE|Exercise WB JEE Previous Years Questions (CATEGORY 1 : Single Option Correct Type)|15 VideosSOLID STATE ELECTRONS
MTG-WBJEE|Exercise WB JEE Previous Years Questions (CATEGORY 1 : Single Option Correct Type)|15 VideosPARTICLE NATURE OF LIGHT AND WAVE PARTICLE DUALISM
MTG-WBJEE|Exercise WB JEE PREVIOUS YEARS QUESTIONS|15 VideosTHERMODYNAMICS
MTG-WBJEE|Exercise WB JEE Previous Years Questions|12 Videos
Similar Questions
Explore conceptually related problems
MTG-WBJEE-SOLID STATE ELECTRONS -WB JEE WORKOUT (CATEGORY 3 : Single Option Correct Type)
- In a p- n junction diode not connected to any circuit,
Text Solution
|
- In the following circuit, the output Y for all possible inputs A and B...
Text Solution
|
- In Fig. V(0) is the potential barrier across a p-n junction, when no b...
Text Solution
|
- In figure , assuming the diodes to be ideal ,
Text Solution
|
- Truth table for the given circuit is
Text Solution
|
- In the circuit shown(Fig.) if the diode forward voltage drop is 0.3 V,...
Text Solution
|
- The real time variation of input signals A and B are as shown below. I...
Text Solution
|
- The logic circuit shown below has the input waveforms 'A' and 'B' as ...
Text Solution
|
- If beta, R(L) and r are the AC current gain, load resistance and the i...
Text Solution
|
- In a semiconductor material (1//5)th of the total current is carried b...
Text Solution
|
- An n-p-n transistor can be considered to be equivalent to two diodes, ...
Text Solution
|
- In the given circuit the current through the zener diode is
Text Solution
|
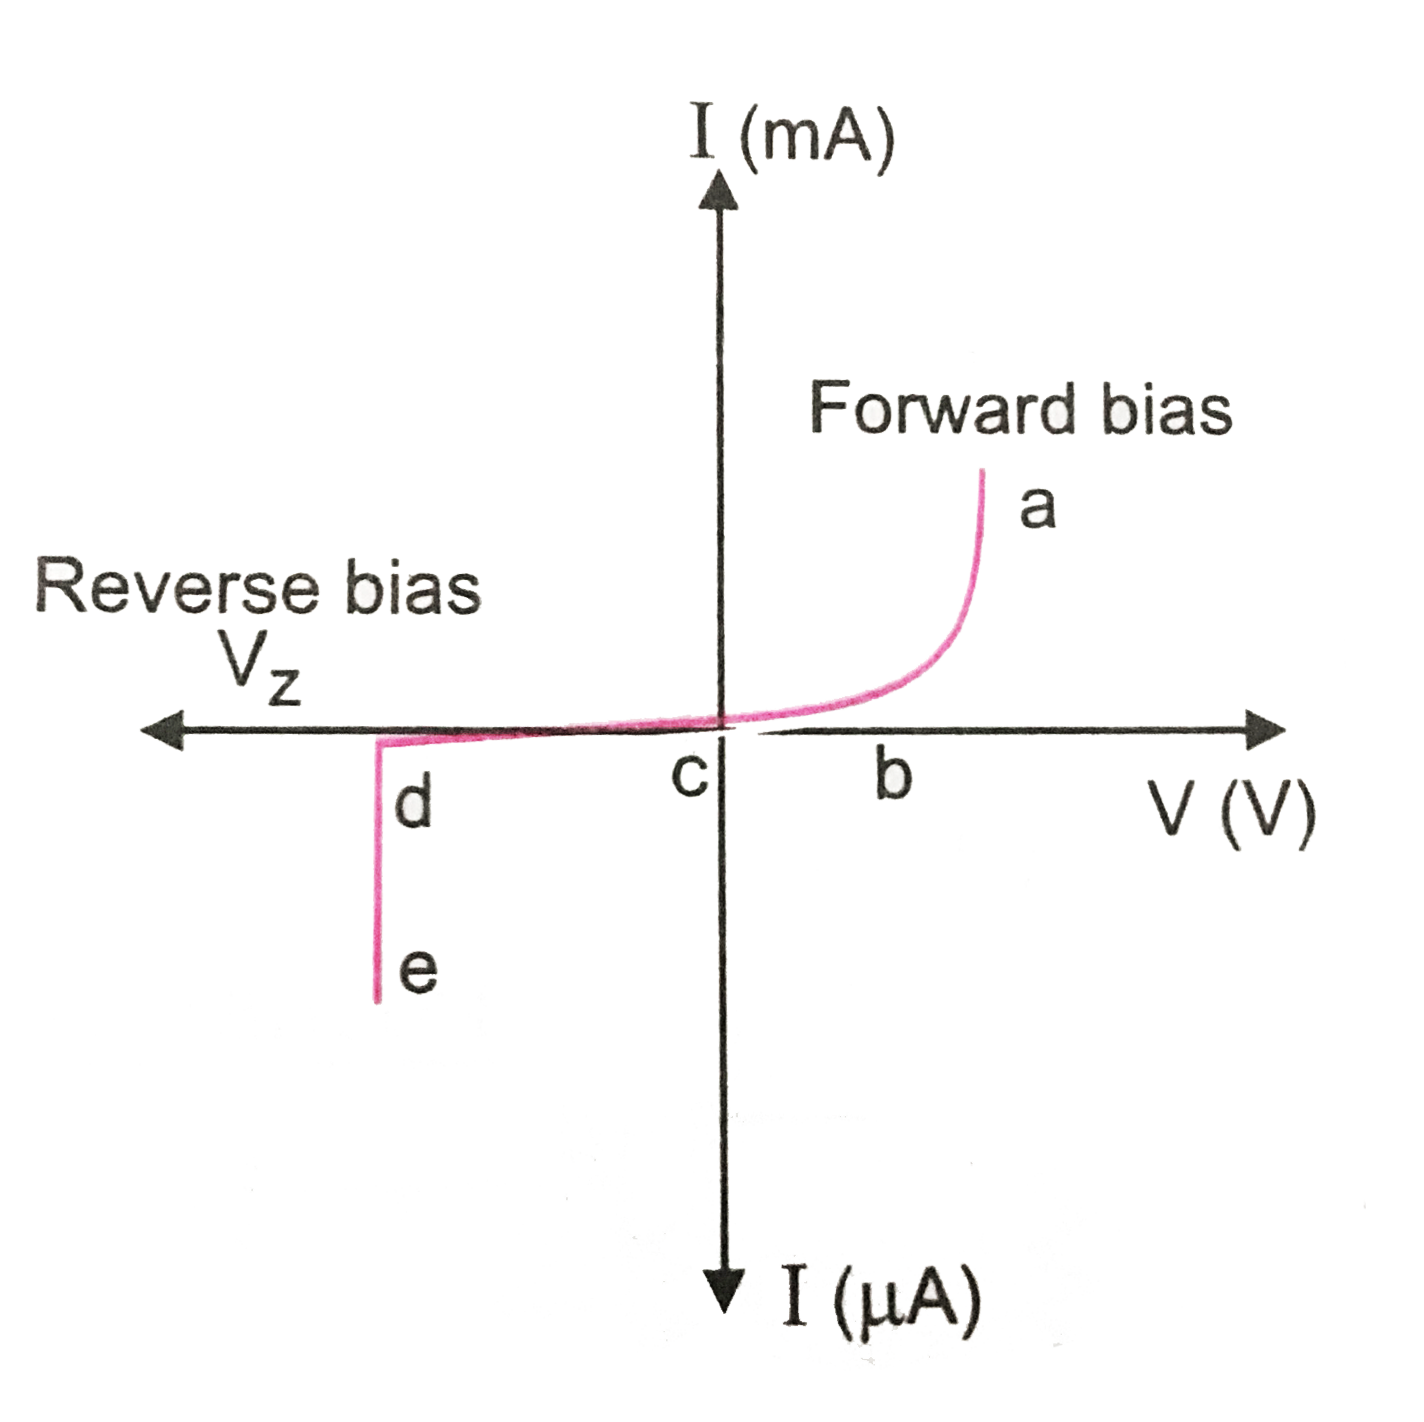
- The graph shown in Fig. represents the I-V characteristics of a zener ...
Text Solution
|
- The diode used in the circuit shown in the figure has a constant volta...
Text Solution
|
- Truth table for system of four NAND gates as shown is
Text Solution
|