


Similar Questions
Explore conceptually related problems
Recommended Questions
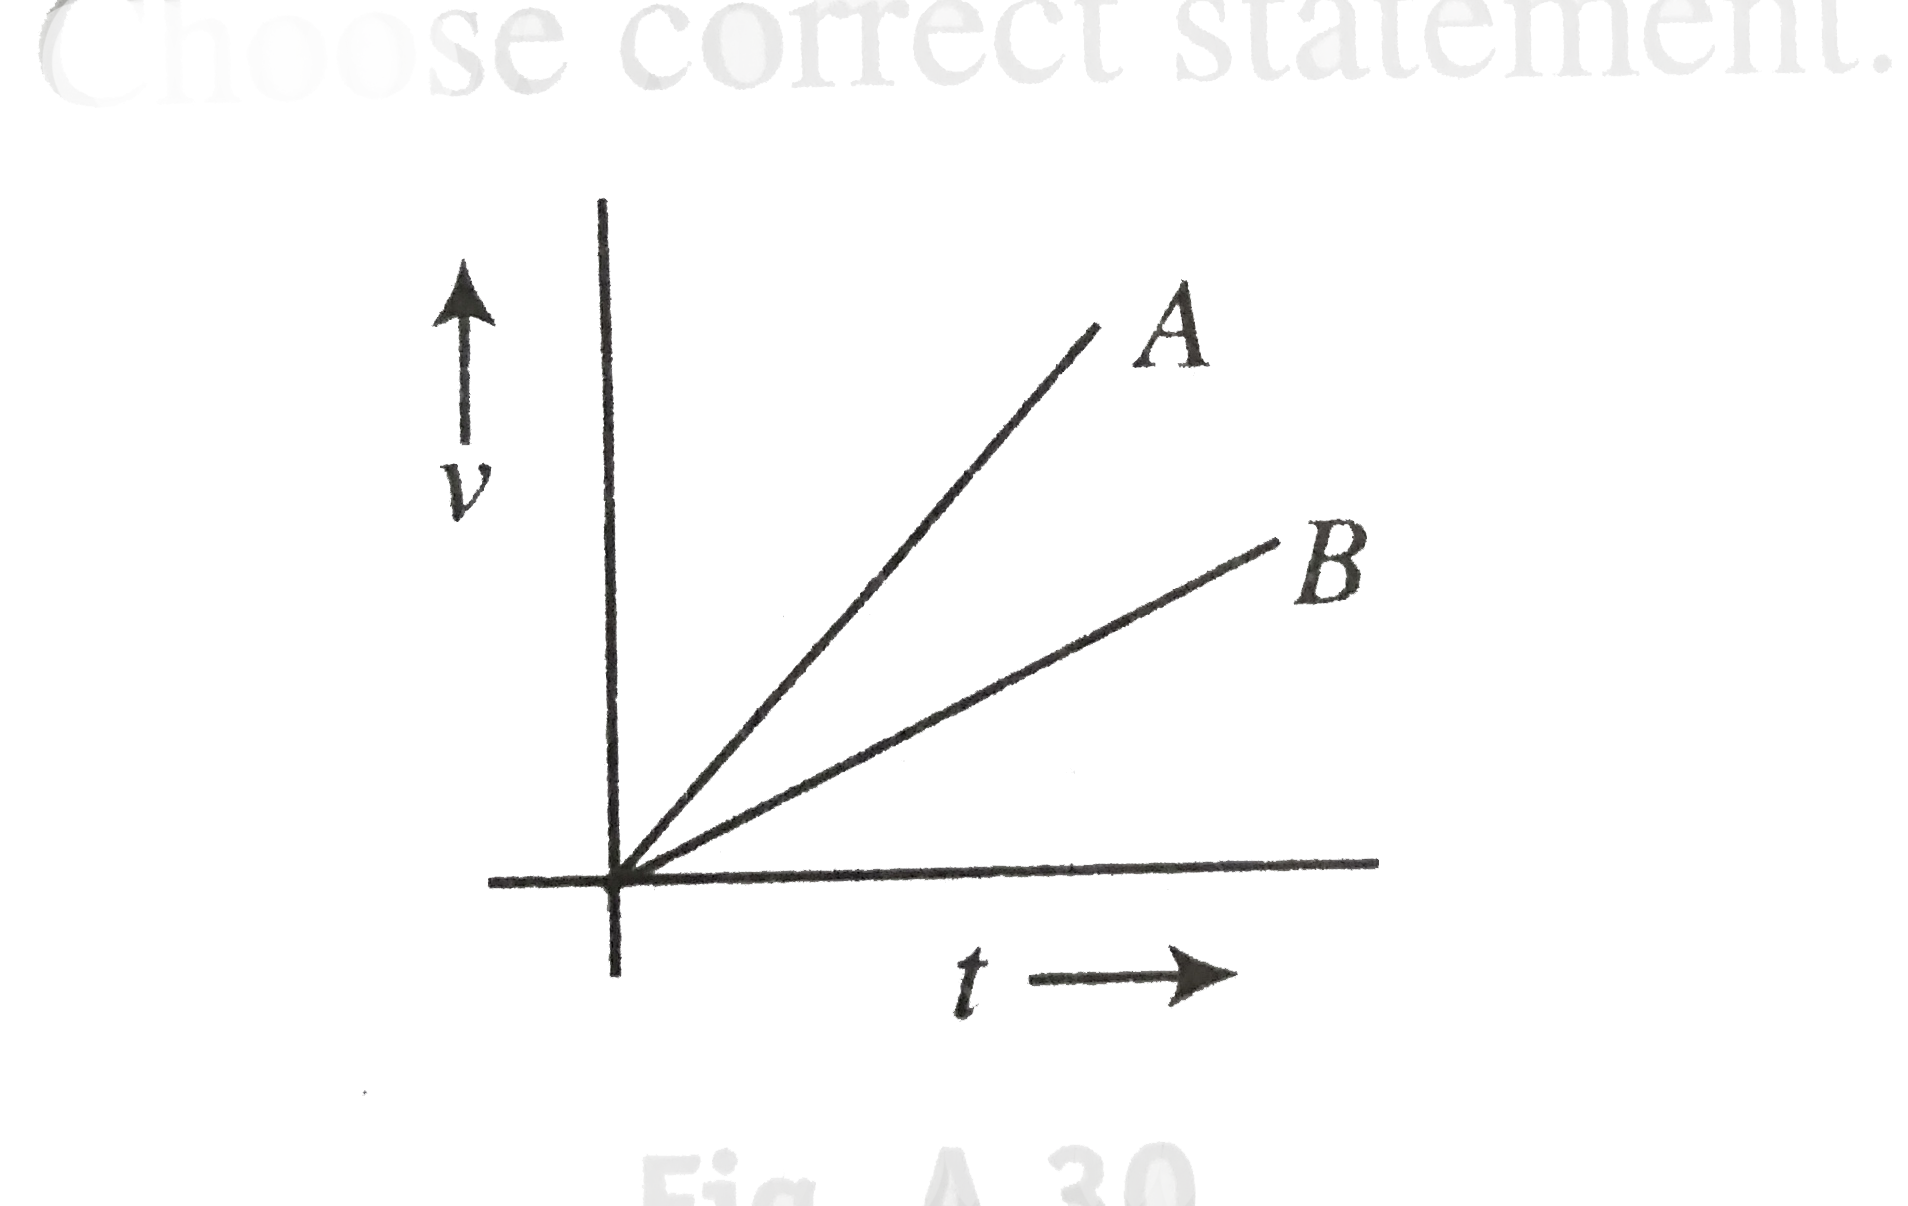
- The velocity - time graph of two bodies A and B is shown in figure. Ch...
Text Solution
|
- The velocity - time graph of two bodies A and B is shown in figure. Ch...
Text Solution
|
- If velocity-time graph of a body is as shown in figure, what is the na...
Text Solution
|
- (a) The velocity time graph of two bodies are shown in Figure. Slope o...
Text Solution
|
- The displacement time graphs of two bodies A and B are shown in figure...
Text Solution
|
- The velocity - time graph for two bodies A and B are shown in figure. ...
Text Solution
|
- The velocity-time graph of a body moving in a straight line is shown i...
Text Solution
|
- Velocity -time graph for a body of mass 10 kg is shown in figure. Work...
Text Solution
|
- Velocity versus time graph of a body is shown in figure. It explains t...
Text Solution
|