


Similar Questions
Explore conceptually related problems
Recommended Questions
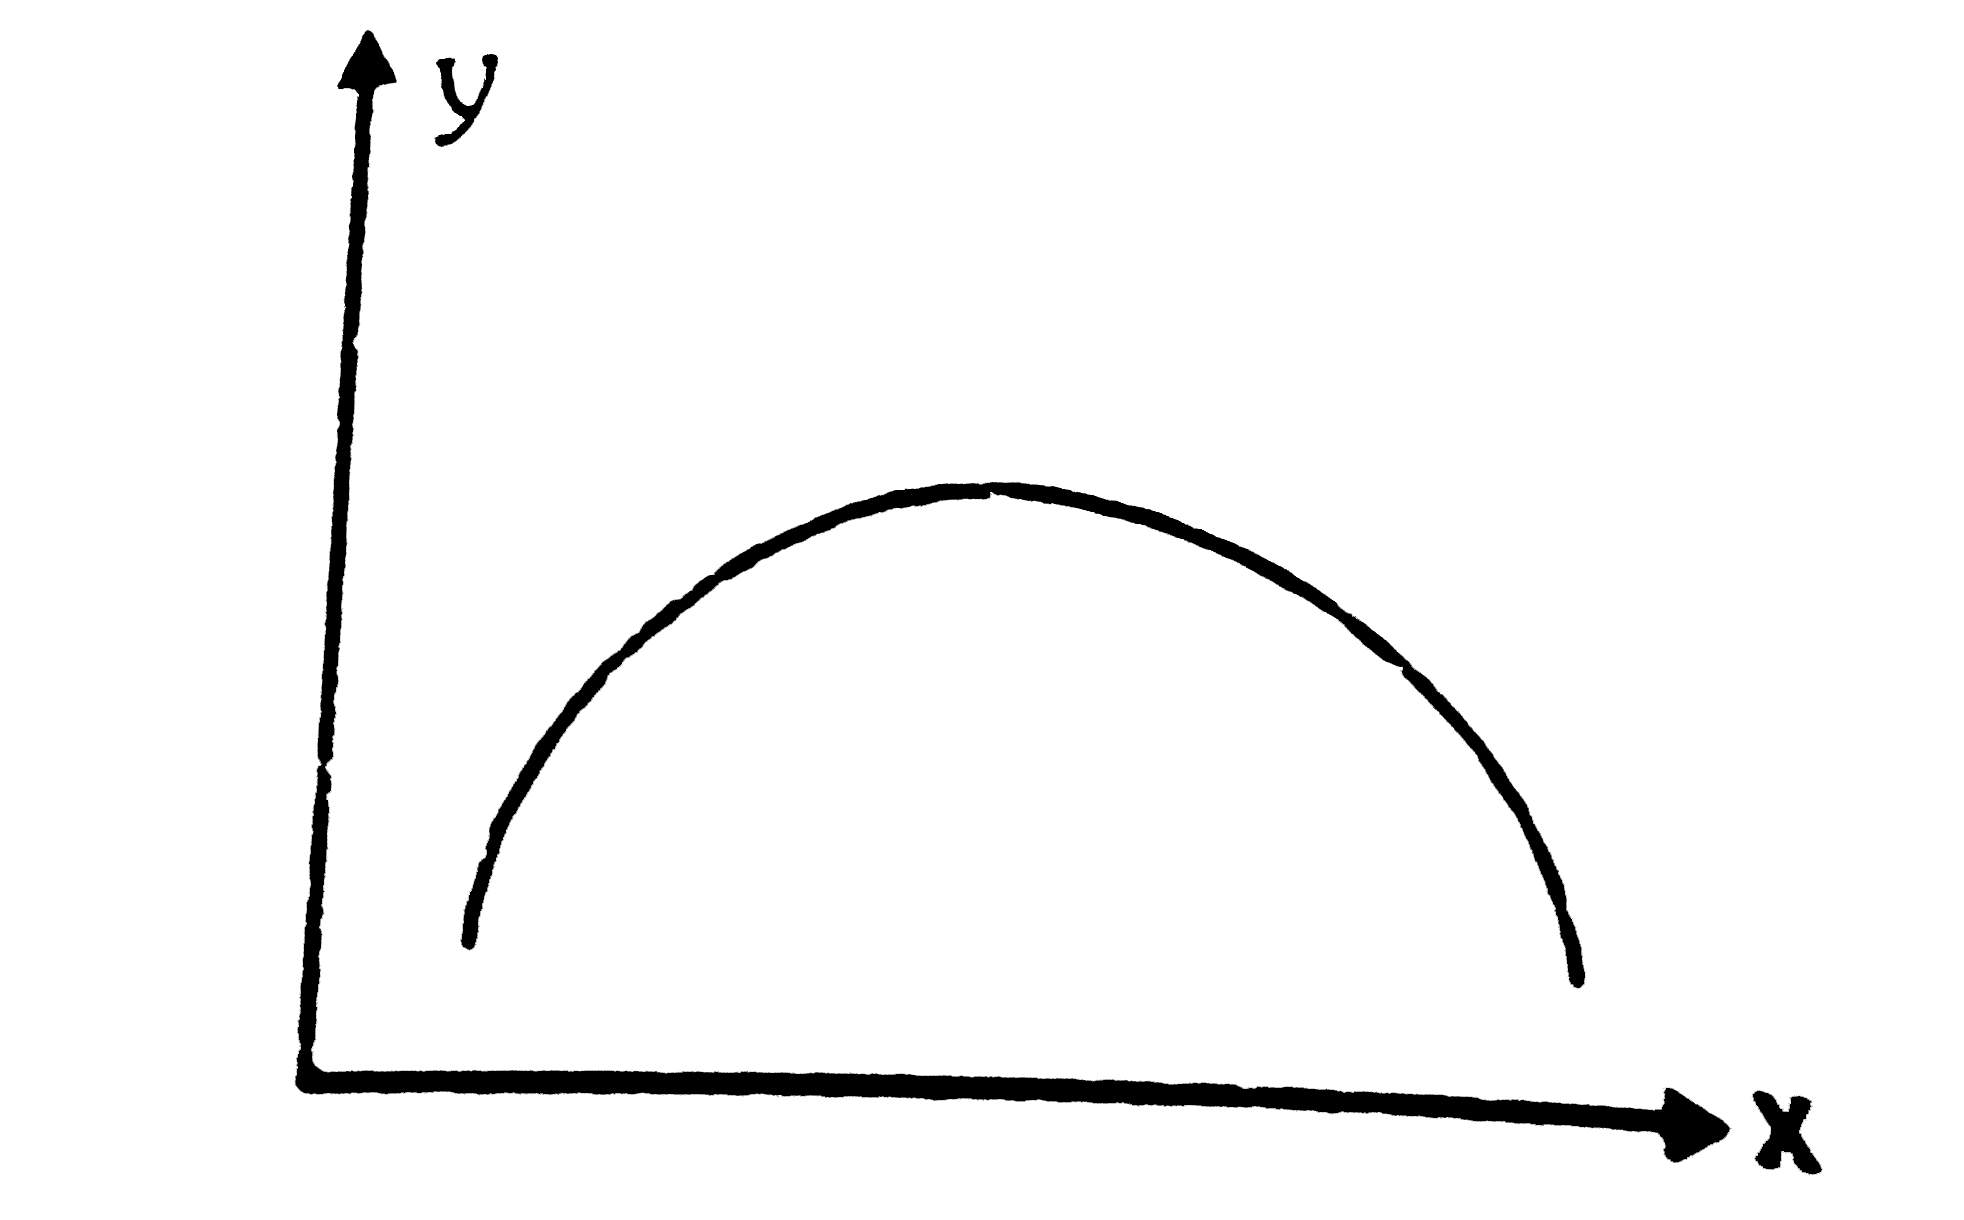
- Magnitude of slope of the shown graph.
Text Solution
|
- The acceleration - velocity graph of a particle moving in a straight l...
Text Solution
|
- For the shown graph slope of graph from point A to point B :
Text Solution
|
- Assertion : In the s-t graph as shown in figure, velocity of particle ...
Text Solution
|
- Magnitude of slope of the shown graph.
Text Solution
|
- Magnitude of slope i.e. steepness of graph shown in figure ltimg src="...
Text Solution
|
- When a plot between logk and 1/T is plotted we get the graph as shown....
Text Solution
|
- A : The displacement (s) time graph shown in the figure represents an ...
Text Solution
|
- Acceleration-velocity graph of a particle moving in a straight line is...
Text Solution
|