


Similar Questions
Explore conceptually related problems
Recommended Questions
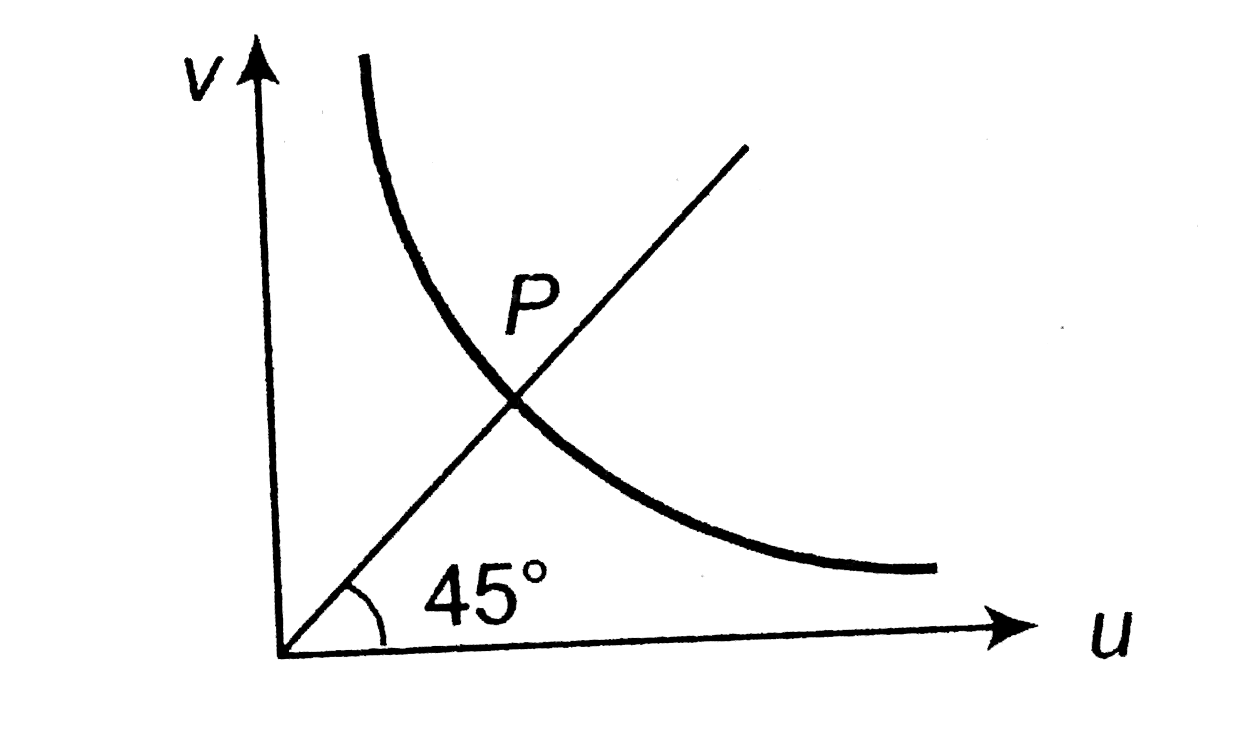
- The graph shows variation of v with change in u for a mirrorr. Points ...
Text Solution
|
- The graph between u and v for a convex mirrorr is
Text Solution
|
- As the position of an object (u) reflected from a concave mirrorr is v...
Text Solution
|
- The graph shows variation of v with change in u for a mirrorr. Points ...
Text Solution
|
- The graph in Fig. shows plot of variation of v with change in u for a ...
Text Solution
|
- P is a point at a distance r from the centre of a solid sphere of radi...
Text Solution
|
- In case of a curved mirror if the distance of object "(u)" and image "...
Text Solution
|
- For a p-V plot, the slope of an adiabatic curve = x × slope of isother...
Text Solution
|
- Plot a graph showing variation of capacitive reactance with the change...
Text Solution
|