


Similar Questions
Explore conceptually related problems
Recommended Questions
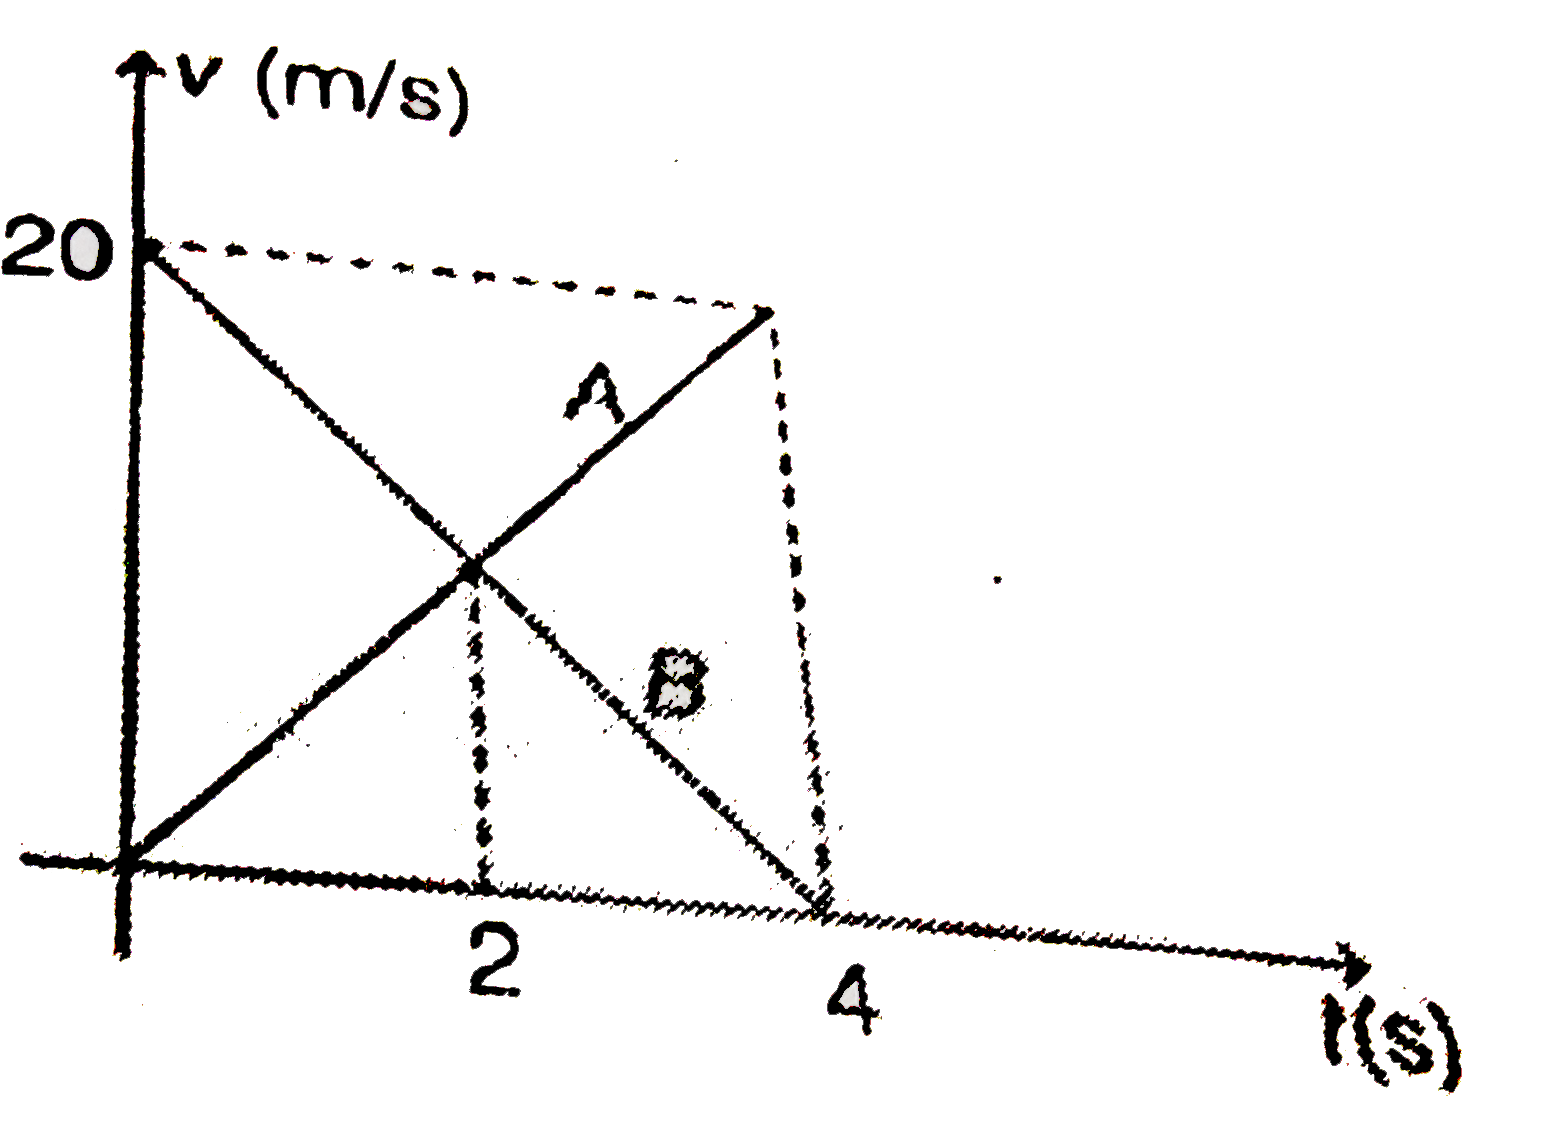
- Speed time graph of two cars A and B approaching towards each other is...
Text Solution
|
- Two cars A and B moving on two straight tracks inclined at an angle 60...
Text Solution
|
- Speed time graph of two cars A and B approaching towards each other is...
Text Solution
|
- Distance between two places A and B is 210 km .Two cars start simultan...
Text Solution
|
- दो स्थानों A और B की दूरी 70 किमी है। दो कारें A व B से चलना प्रारम्भ ...
Text Solution
|
- एक राष्ट्रीय राजमार्ग पद दो स्थानों A तथा B के बीच की दूरी 100 किमी है...
Text Solution
|
- निम्नलिखित समस्याओं की रैखिक समीकरण युग्म बनाइए और हल (यदि हों) ज्ञात...
Text Solution
|
- Two cars A and B are running towards each other from two different pla...
Text Solution
|
- Two cars are moving towards each other with equal speed of 72 km h^(-1...
Text Solution
|