


Similar Questions
Explore conceptually related problems
Recommended Questions
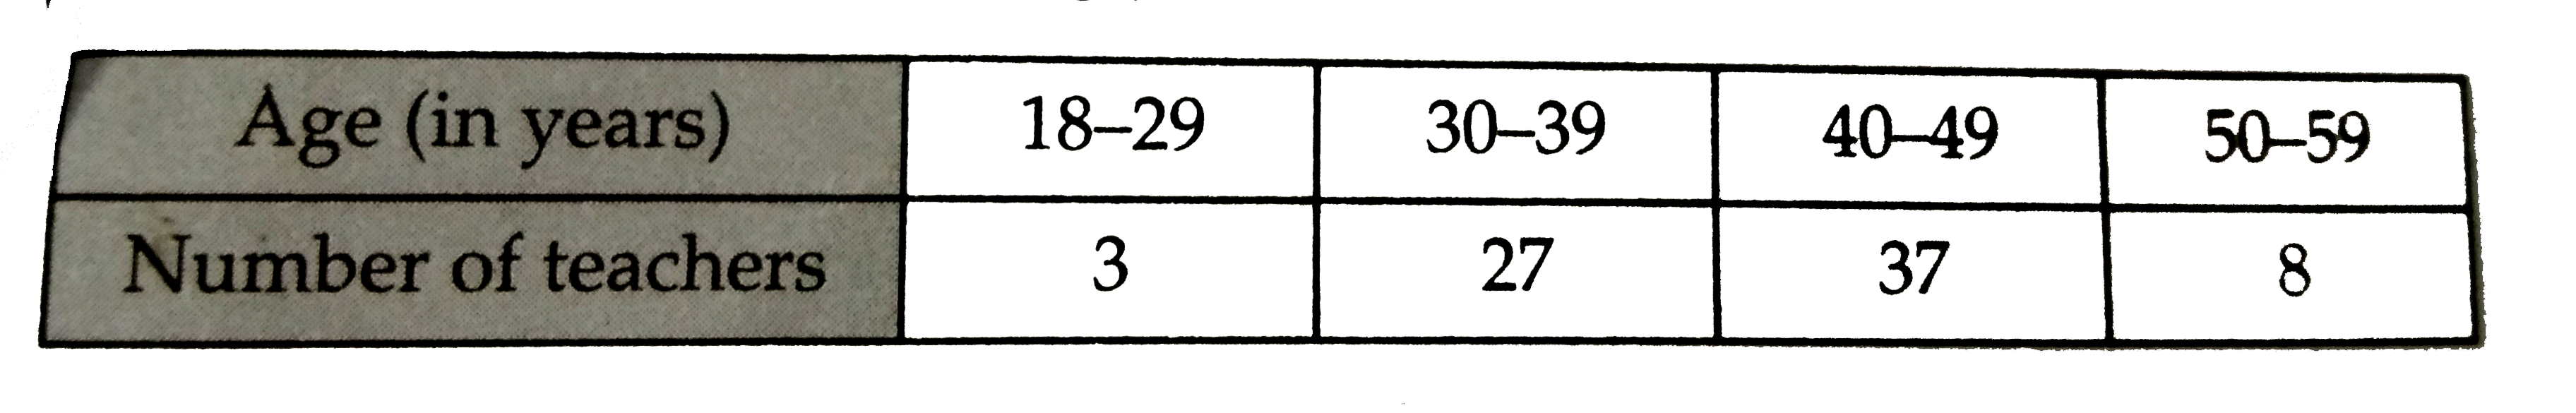
- The table given below shows the ages of 75 teachers in a school . ...
Text Solution
|
- The ages in years of 10 teachers of a school are: 32, 41, 28, 54, 35, ...
Text Solution
|
- एक स्कूल के 10 शिक्षकों में से एक शिक्षक सेवानिवृत हो जाता है और उसके ...
Text Solution
|
- The inequation represented by the graph given below is : <img src="htt...
Text Solution
|
- The inequation that best describes the graph given below is <img src=...
Text Solution
|
- The table given below shows the ages of 75 teachers in a school . ...
Text Solution
|
- The mean ago of 25 teachers in a schools is 40 years. A teacher retire...
Text Solution
|
- The mean age of 25 teanchers of a school is 40 years. A teacher retire...
Text Solution
|
- There are 25 teacher in a school , the average age of teacher is 40. I...
Text Solution
|