


Similar Questions
Explore conceptually related problems
Recommended Questions
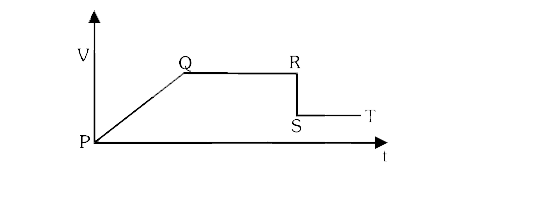
- V–t graph is obtained as shown in the figure. The work done by the for...
Text Solution
|
- V-T graph of a process of monoatomic ideal gas is shown in figure. ...
Text Solution
|
- The x -t graph shown in figure represents
Text Solution
|
- In the V-T graph shown in figure match the following.
Text Solution
|
- V–t graph is obtained as shown in the figure. The work done by the for...
Text Solution
|
- The graph in figure shows the velocity v versus time t for a body. Whi...
Text Solution
|
- P – V graph for a cyclic process is shown in figure . Work done is giv...
Text Solution
|
- The x-t graph shown in figure represents
Text Solution
|
- An ideal gas passes along path ABCA of P to V graph as shown here. The...
Text Solution
|