Home
Class 11
PHYSICS
Figure shows an isochore, an isotherm, a...

Figure shows an isochore, an isotherm, an adiabatic and two isobars of two gases on a work done versus heat supplied curve. The initial states of both gases are the same and the scales for the two axes are same.

Promotional Banner

Similar Questions

Explore conceptually related problems

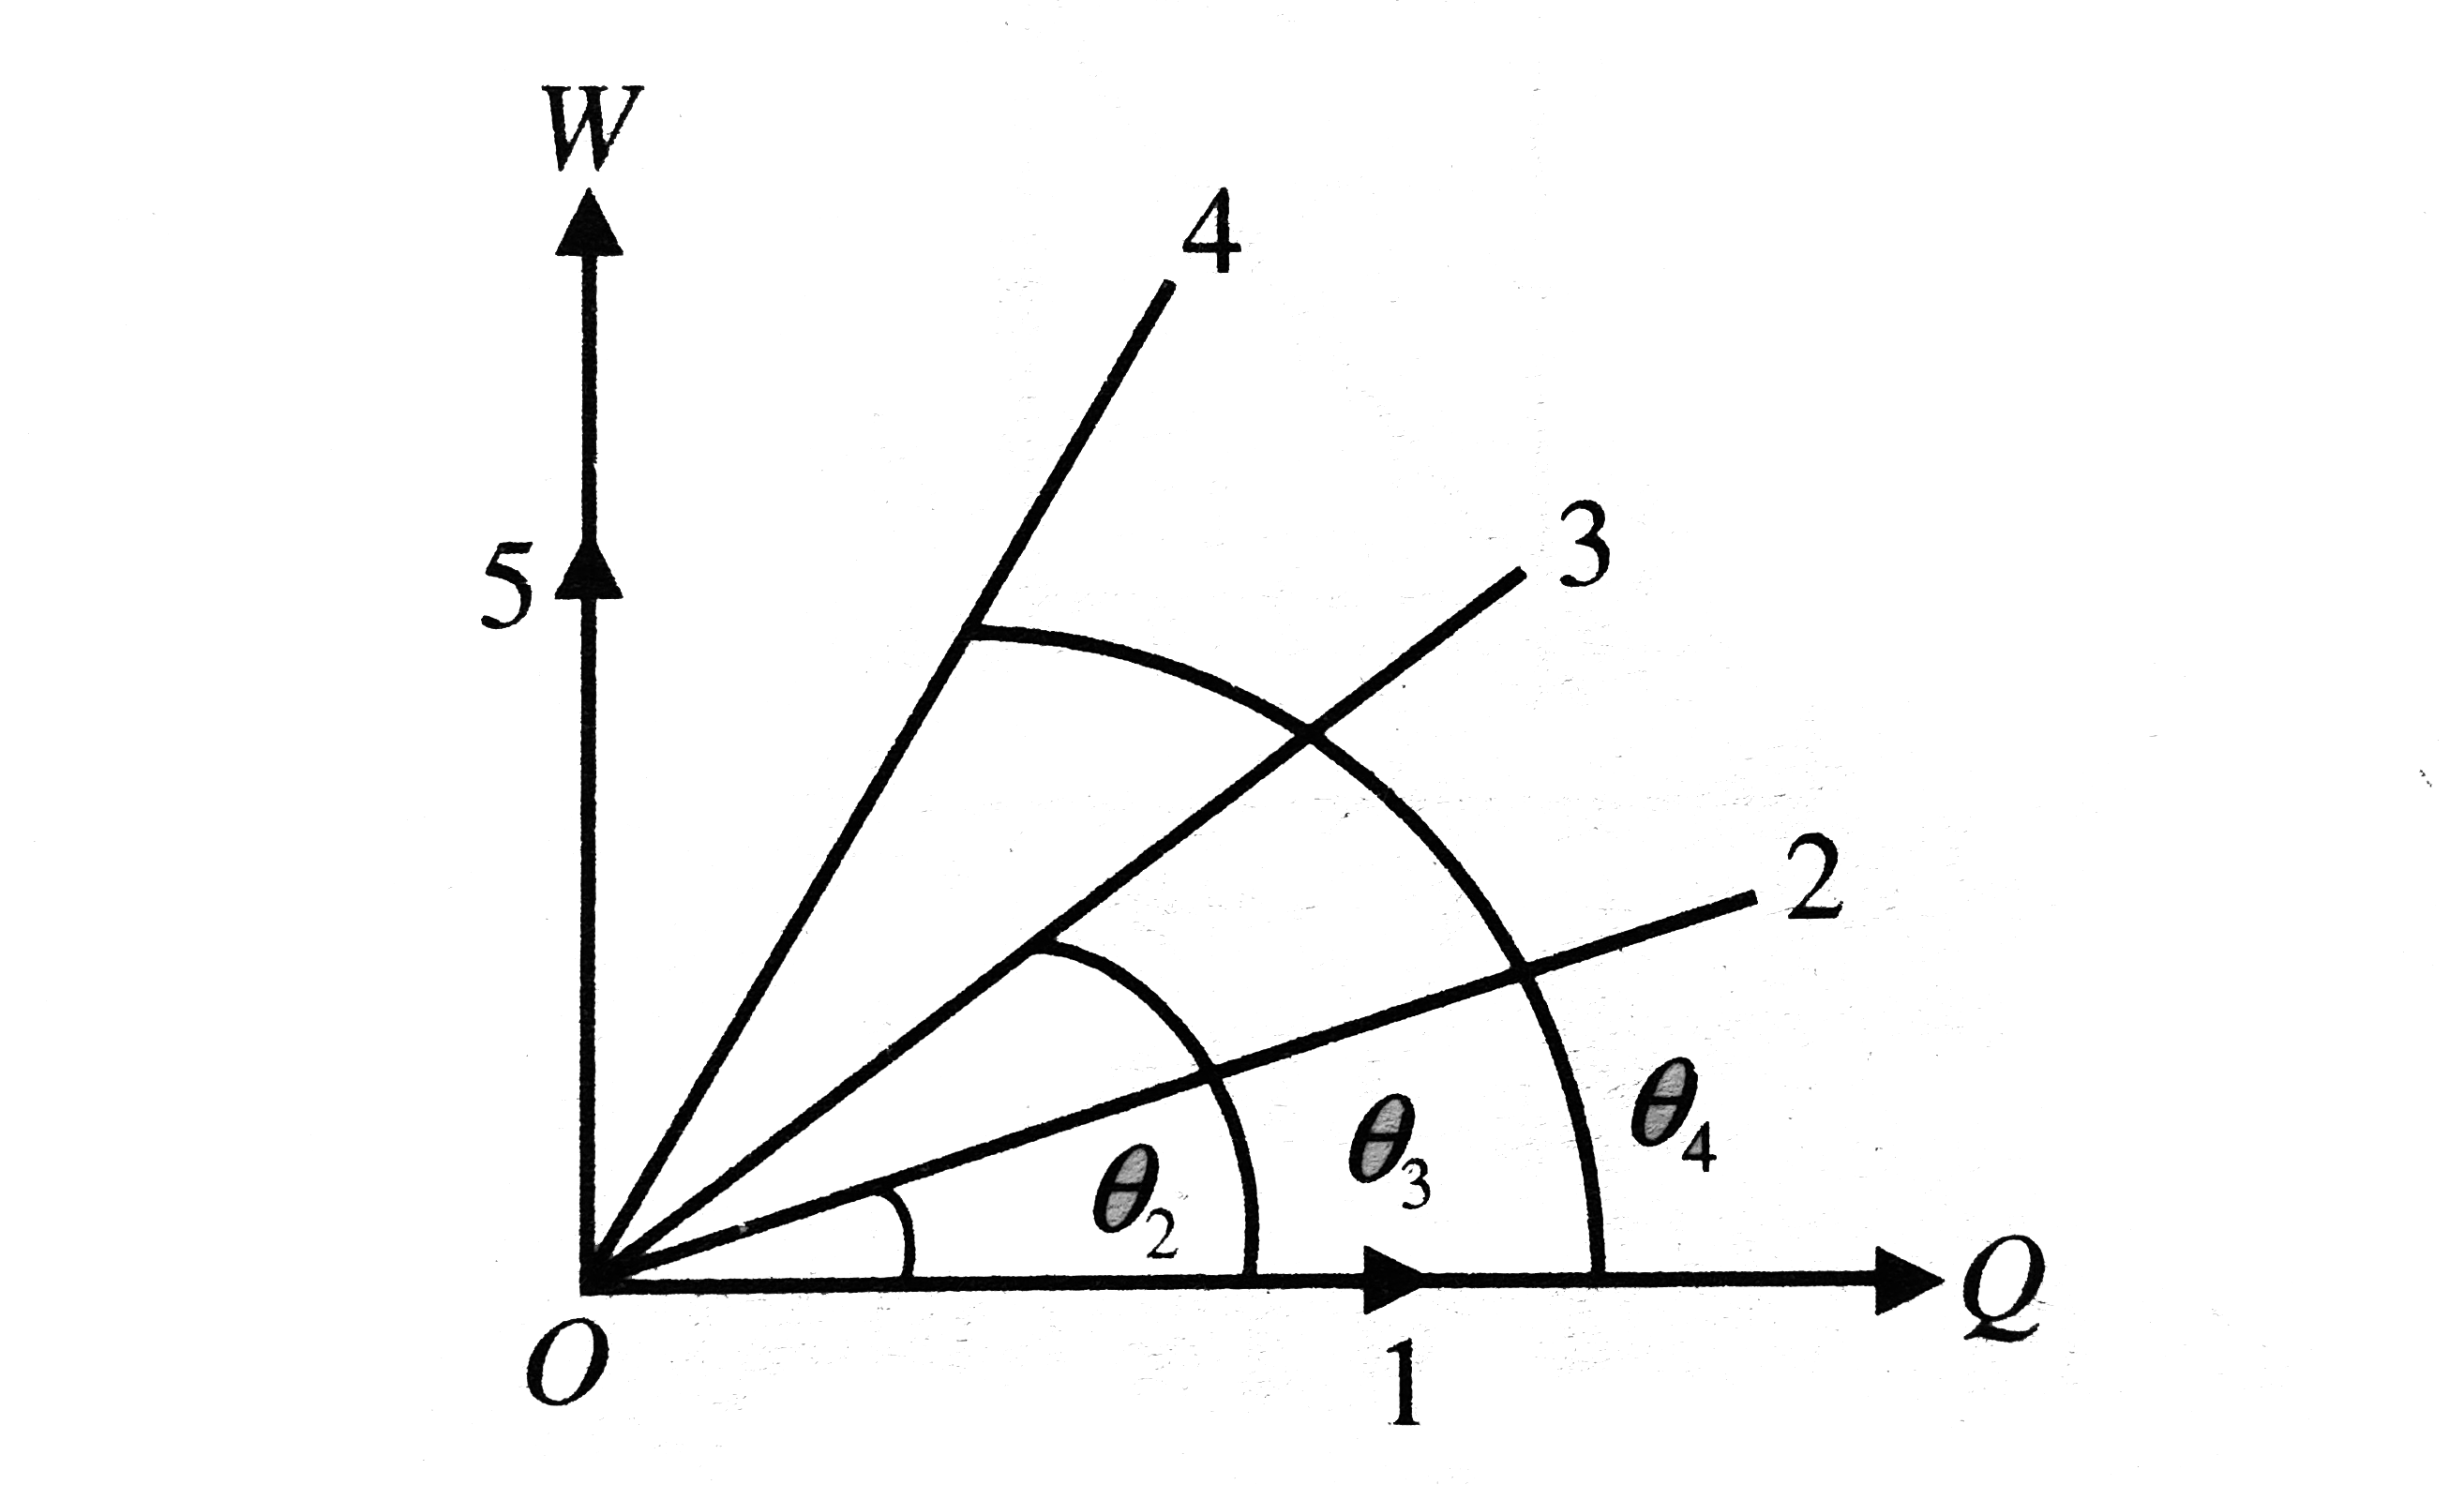
The amount of heat supplied to an ideal gas is laid off on the horizontal axis and the amount of work performed by the g-as is laid off on the vertical axis. One of the straight lines in the ligure is an isotherm and the other two are isobars of two gases. The initial states of hoth gases (pressure, temperature, volume) are the same, and the scales on the two axes coincide. Which straight line corresponds to which process? How many degrees of freedom does each gas have? (Vibrational degrees of freedom are not to be taken into account.) The graphs of what processes coincide with the coordinate axes?

Figure shows the variation in temperature (DT) with the amount of heat supplied (Q) in an isobaric process corresponding to a monoatomic (M), diatomic (D) and a polyatomic (P) gas. The initial state of all the gases are the same and the scales for the two axes coincide. Ignoring vibrational degrees of freedom, the lines a, b and c respectively correspond to

A gas is first compressed adiabatically and then isothermally. In both cases, the initial state of the gas is the same. Find in which case more work is done on the gas.

Under the same conditions, two gases have the same number of molecules. They must

Under the same conditions, two gases have the same number of molecules. They must:

Under the same conditions, two gases have the same number of molecules. They must

Under the same conditions, two gases have the same number of molecules. They must