


Similar Questions
Explore conceptually related problems
Recommended Questions
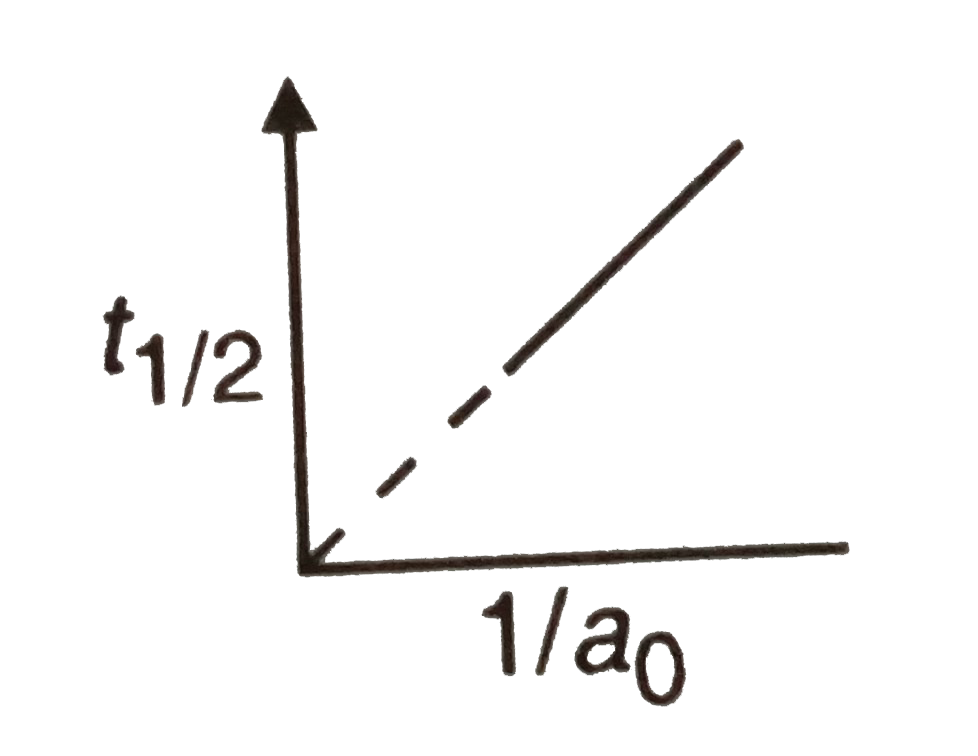
- The following graph shows how t(1//2) (half-life) of a reactant R chan...
Text Solution
|
- The following graph shows how t(1//2) (half-life) of a reactant R chan...
Text Solution
|
- For a reaction R rarr P , half -life (t(1//2)) is observed to be indep...
Text Solution
|
- The half-life of a first order reaction is 30 min and the initial conc...
Text Solution
|
- The half life of a first order reaction is 30 min and the initia...
Text Solution
|
- For a reaction R to P , half-life (t(1//2)) is observed to be independ...
Text Solution
|
- For a reaction RrarrP, half-life (t(1//2)) is observed to be independ...
Text Solution
|
- The product of half life T(1//2) and the square of initial concentrati...
Text Solution
|
- The following graph shows how t(1//2) (half-life) of a reactant R chan...
Text Solution
|