


Similar Questions
Explore conceptually related problems
Recommended Questions
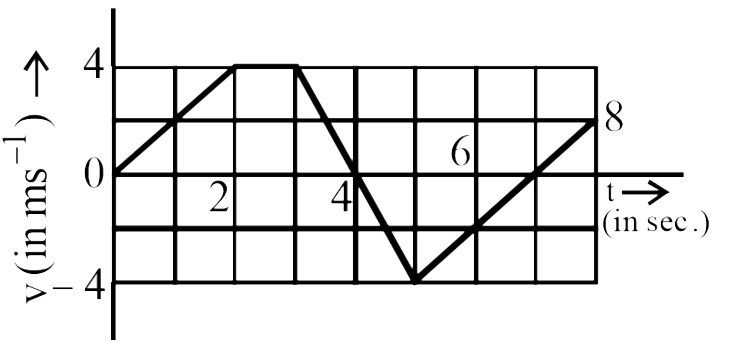
- Figure here gives the speed-time graph for a body. The displacement tr...
Text Solution
|
- Figure here gives the speed-time graph for a body. The displacement tr...
Text Solution
|
- In the given v-t graph the distance travelled by the body in 5 seconds...
Text Solution
|
- The vecs-t graph of a body is a shown in the figure The time for which...
Text Solution
|
- एक बल के अंतर्गत गतिमान 2 किग्रा द्रव्यमान के पिण्ड के विस्थापन x तथा ...
Text Solution
|
- X -अक्ष पर गतिमान एक कण का स्थिति समय (x-t) ग्राफ चित्र में प्रदर्शित ...
Text Solution
|
- चित्र में एक गतिमान वस्तु का वेग –समय ग्राफ प्रदर्शित है। ज्ञात कीजिए।...
Text Solution
|
- संलग्न चित्र में प्रदर्शित किसी कण के वेग समय ग्राफ से ज्ञात कीजिए- ...
Text Solution
|
- किसी निश्चित दिशा में अनुदिश चल रहे किसी कण का चाल - समय ग्राफ चित्र 3...
Text Solution
|