


Similar Questions
Explore conceptually related problems
Recommended Questions
- The graphs representing distribution of molecular speeds at 300 K for ...
Text Solution
|
- If average molecular mass of air is 29, then assuming N(2) and O(2) ga...
Text Solution
|
- Consider the following equilibrium N(2)O(4)(g)hArr2NO(2)(g) Then ...
Text Solution
|
- The graphs representing distribution of molecular speeds at 300 K for ...
Text Solution
|
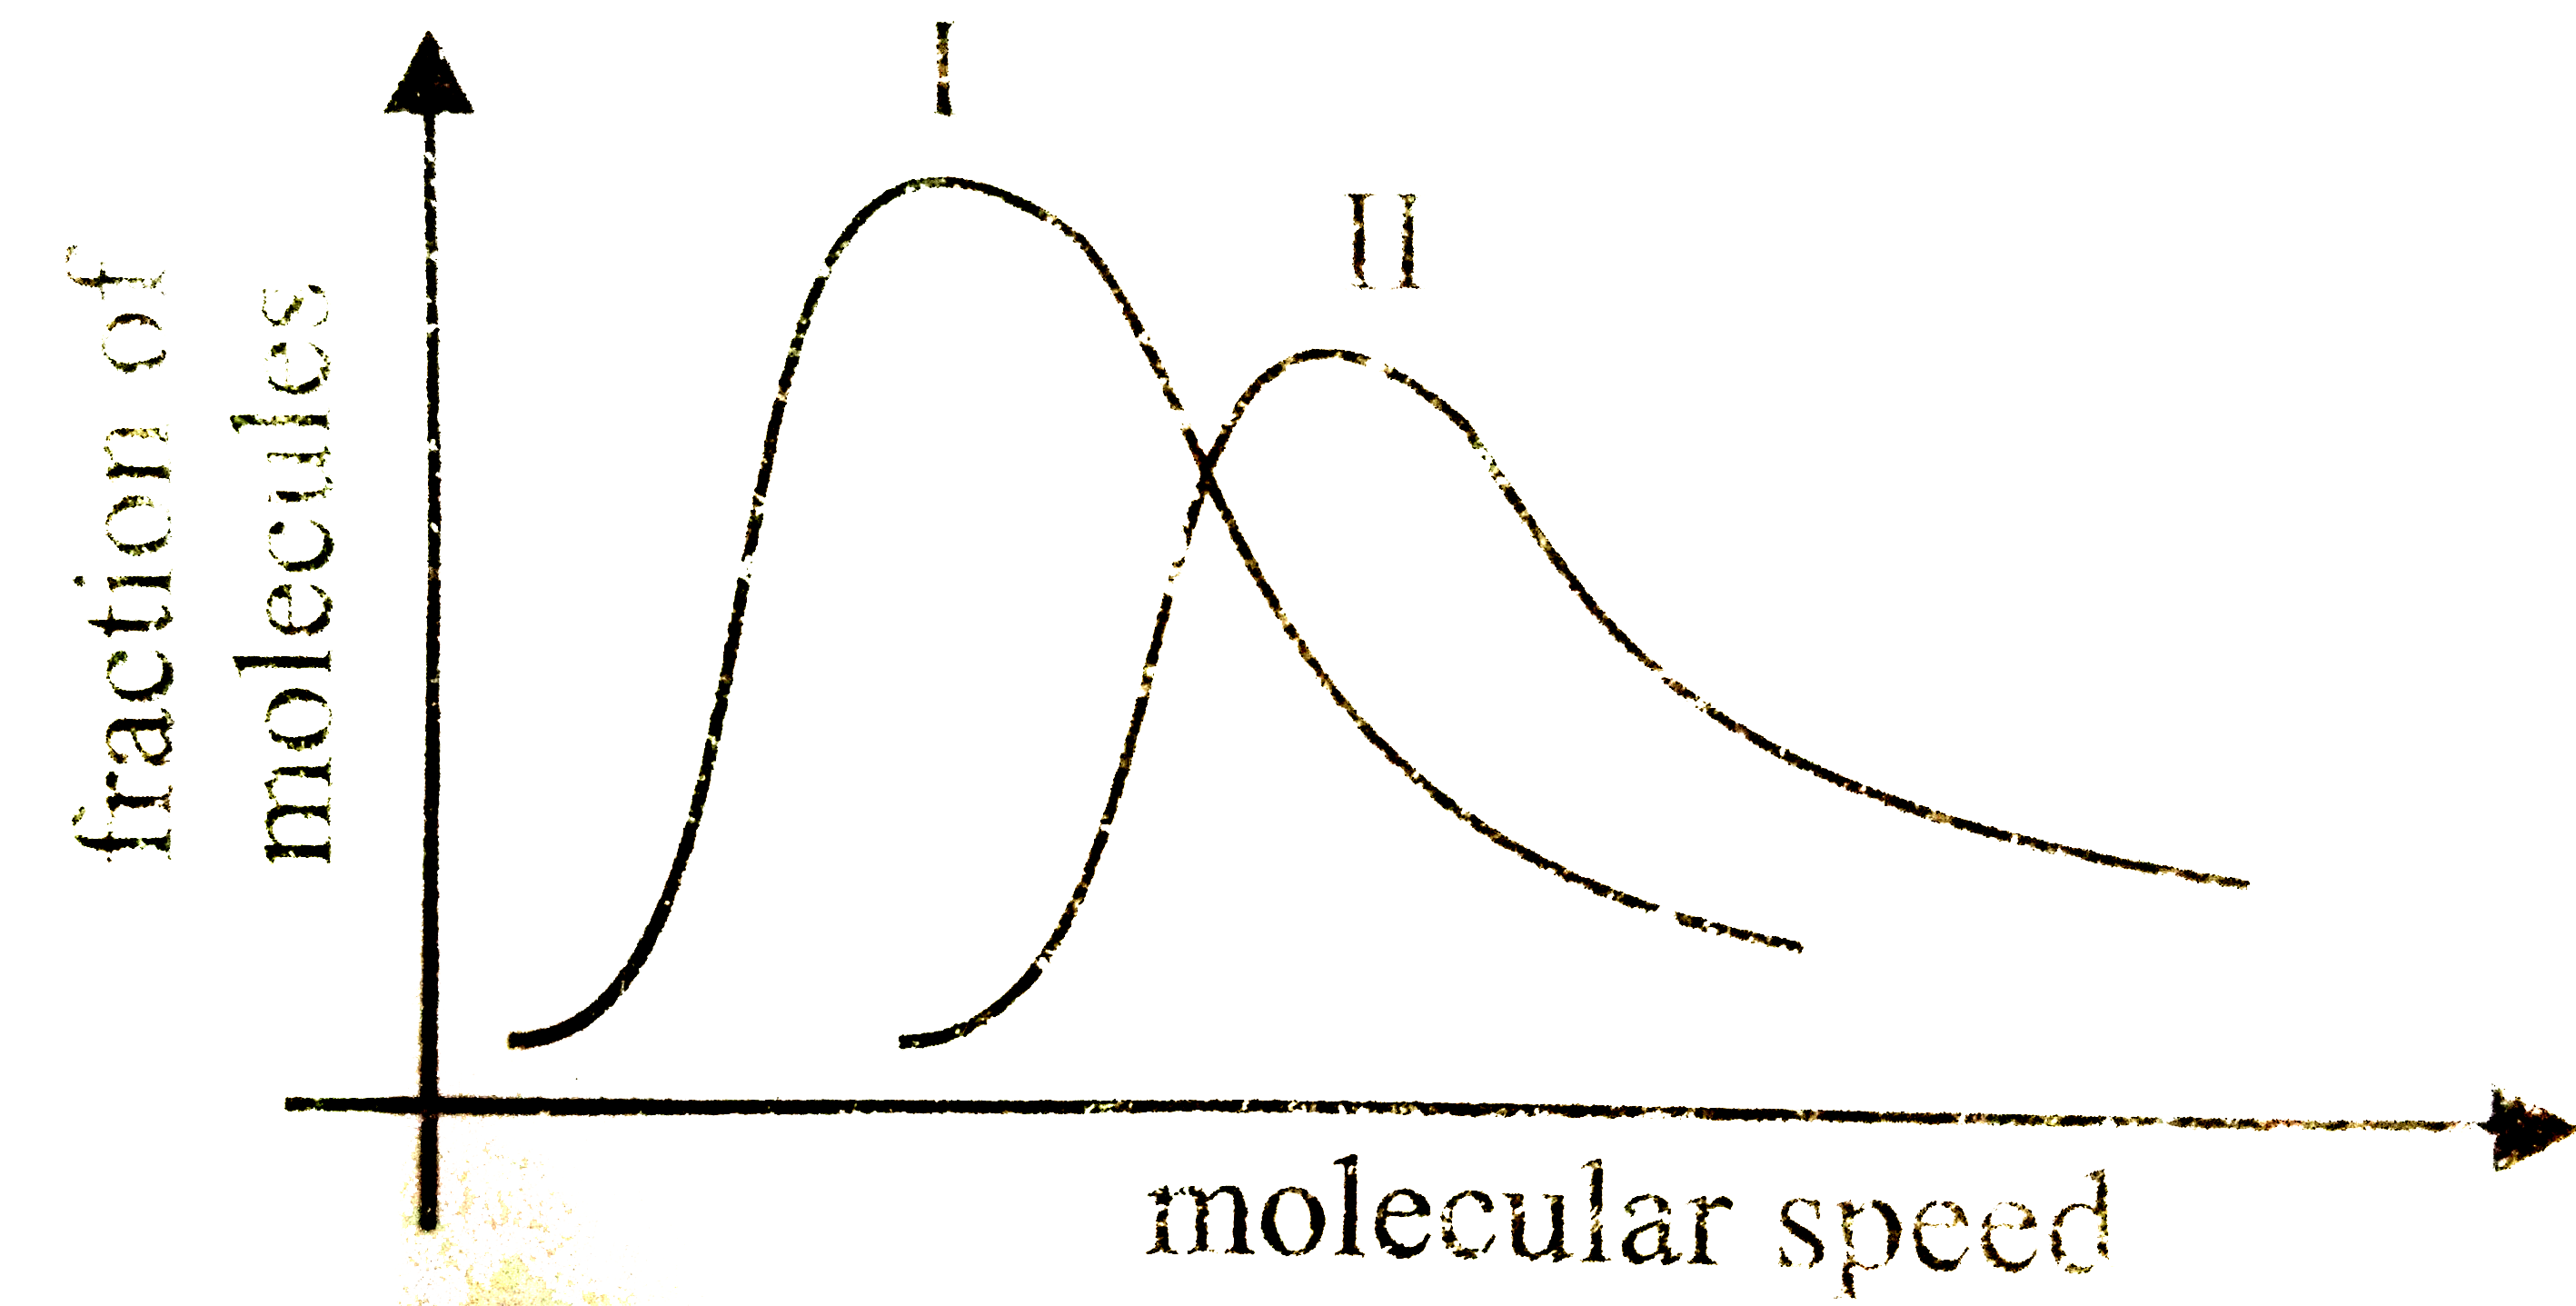
- The graph below shows the distribution of molecular speeds of two idea...
Text Solution
|
- Which of the following graphs regarding Maxwell distribution of speed ...
Text Solution
|
- Explain Maxwell distribution of molecular speed with necessary graph.
Text Solution
|
- In maxwell's speed distribution curve, for N(2 ) gas, the average of |...
Text Solution
|
- The graphs representing distribution of molecular speeds at 300 K for ...
Text Solution
|