


Similar Questions
Explore conceptually related problems
Recommended Questions
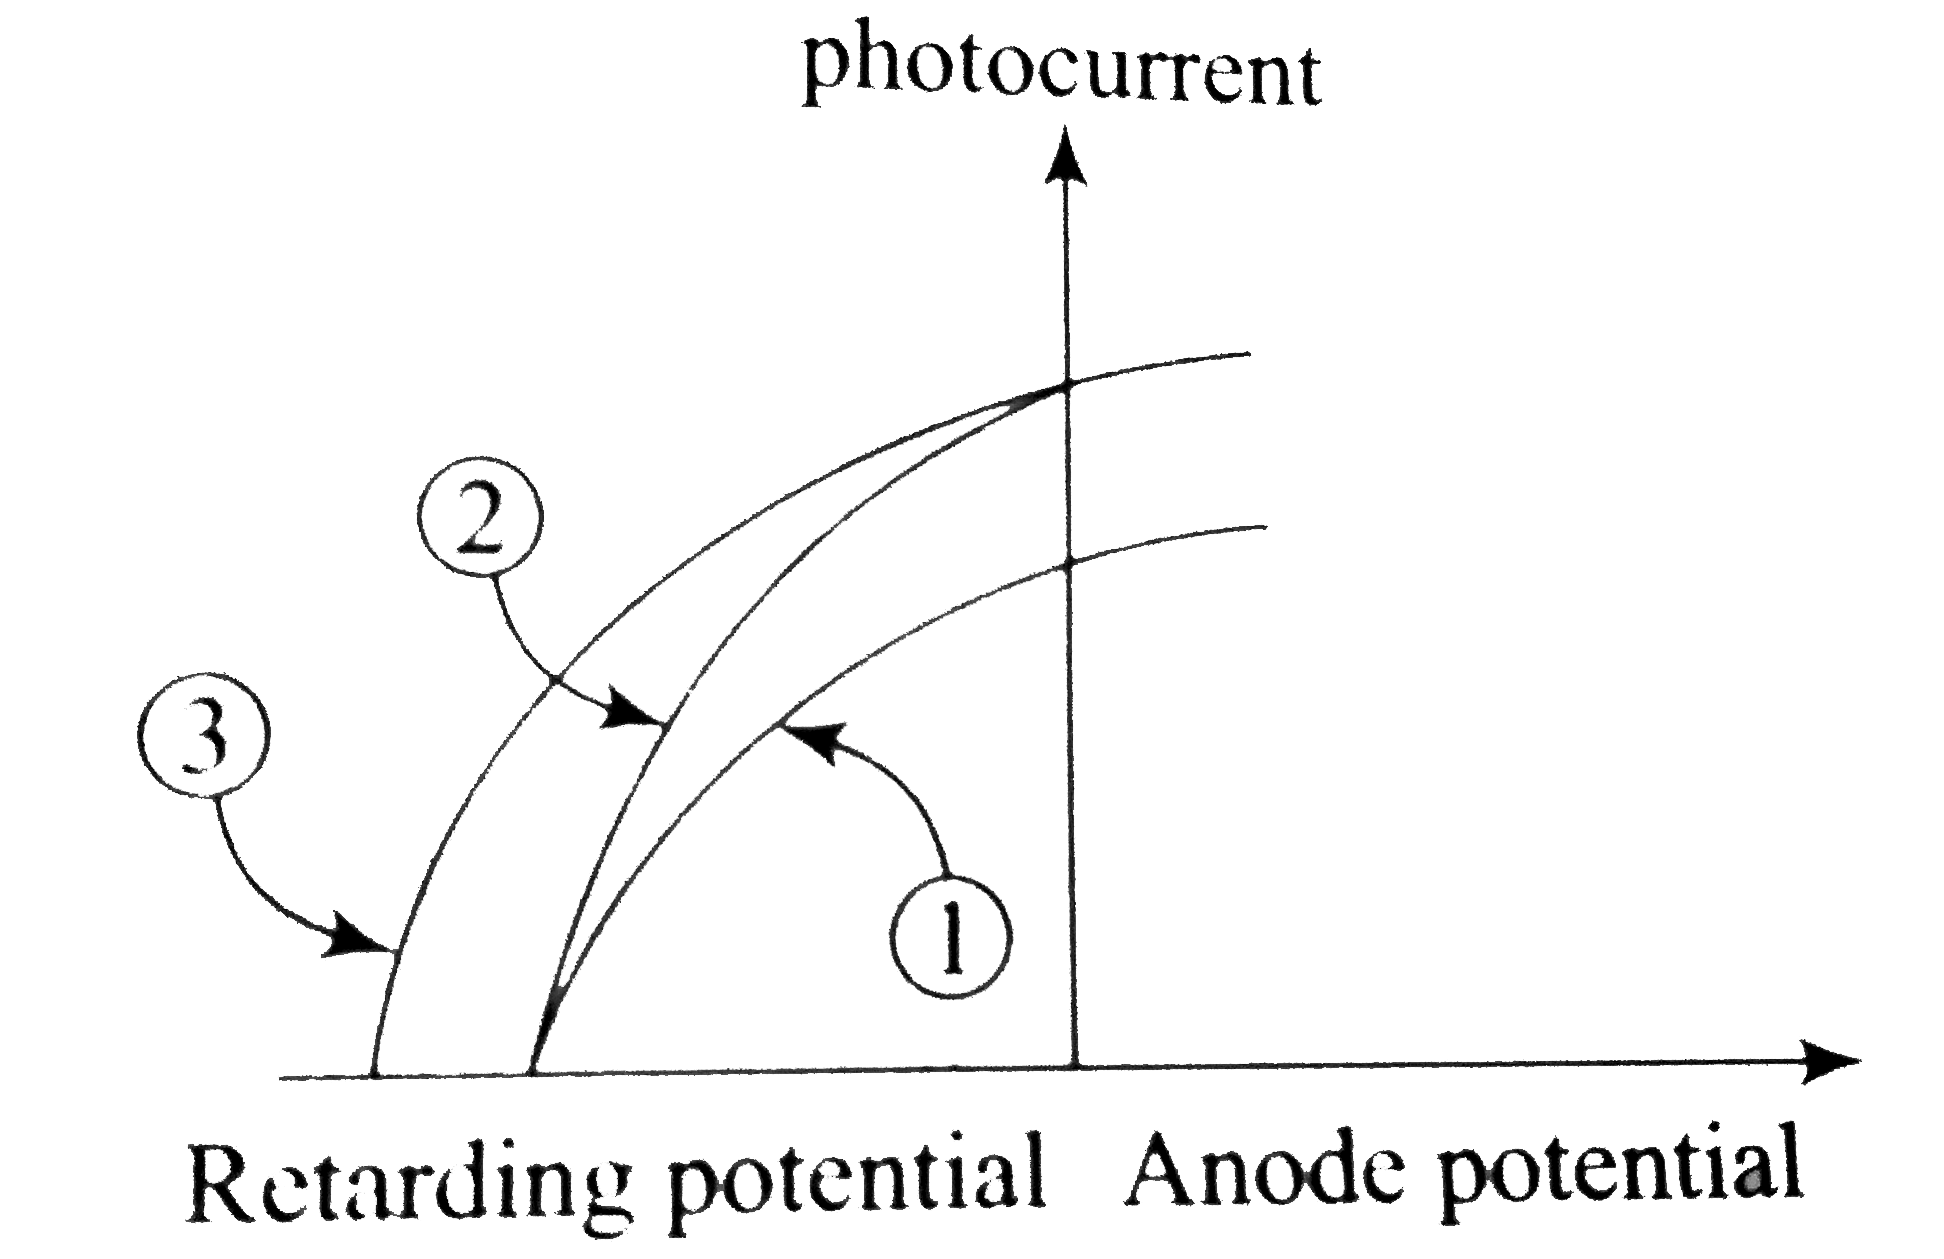
- The figure shows a plot of photo current versus anode potential for a ...
Text Solution
|
- The figure shows a plot of photo current versus anode potential for a ...
Text Solution
|
- Draw a plot showing the variation of photoelectric current versus the ...
Text Solution
|
- The plot of the variation of potential difference across a combination...
Text Solution
|
- In photoelectric experiment the plot between anode potential and photo...
Text Solution
|
- नीचे तीन विभिन्न विकिरणों के लिए प्रकश-विद्युत धारार और ऐनोड विभव के ल...
Text Solution
|
- Draw a plot showing the variation of photoelectric current versus the ...
Text Solution
|
- Fig. shows variation of photocurrent with anode potential for photosen...
Text Solution
|
- Draw a plot showing the variation of photoelectric current versus the ...
Text Solution
|