 .
.


Similar Questions
Explore conceptually related problems
Recommended Questions
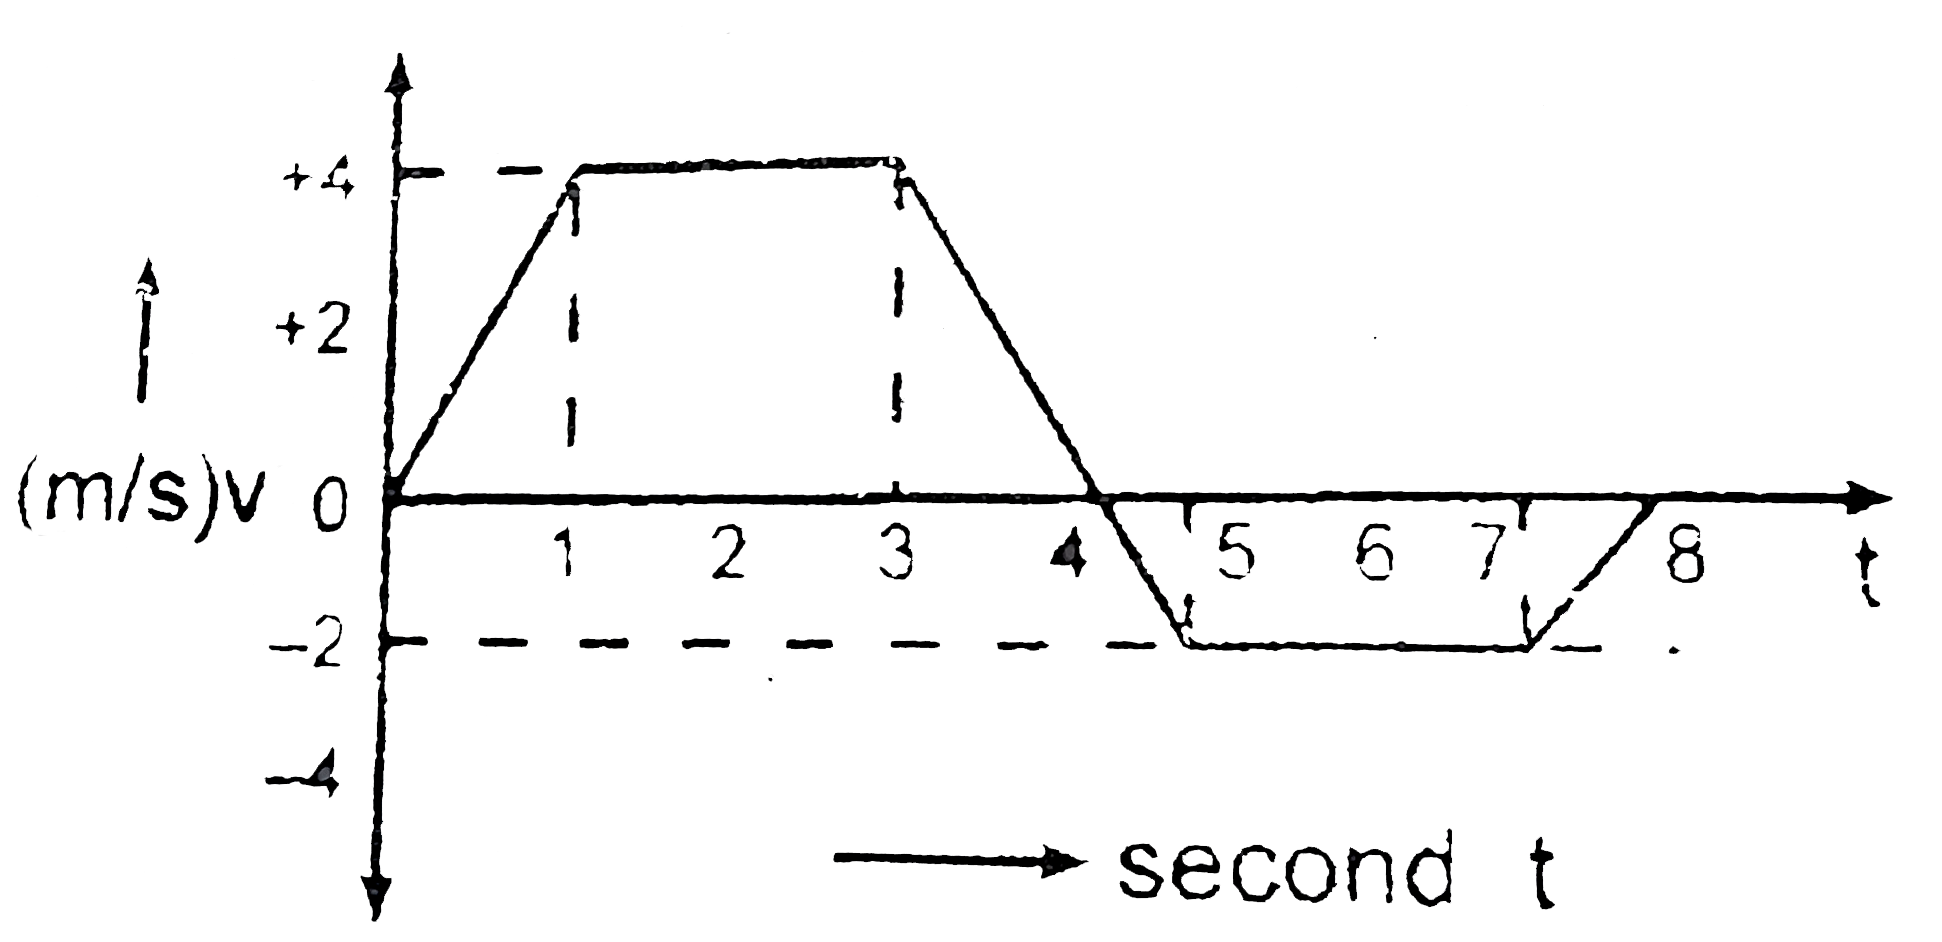
- The velocity time graph of a linear motion is shown in the figure. The...
Text Solution
|
- The velocity-time graph of a particle in straight line motion is veloi...
Text Solution
|
- The velocity-time graph of a linear motion os shown figure. The distan...
Text Solution
|
- A particle starts from rest and undergoes an acceleration as shown in ...
Text Solution
|
- The velocity time graph of a linear motion is shown in the figure. The...
Text Solution
|
- The velocity-time graph of a linear motion is shown in figure. The dis...
Text Solution
|
- The force-time( F – t ) curve of a particle executing linear motion is...
Text Solution
|
- The following figure-1.114 shows the linear motion velocity-time graph...
Text Solution
|
- The velocity-time graph of a linear motion is shown below. The distanc...
Text Solution
|