


Similar Questions
Explore conceptually related problems
Recommended Questions
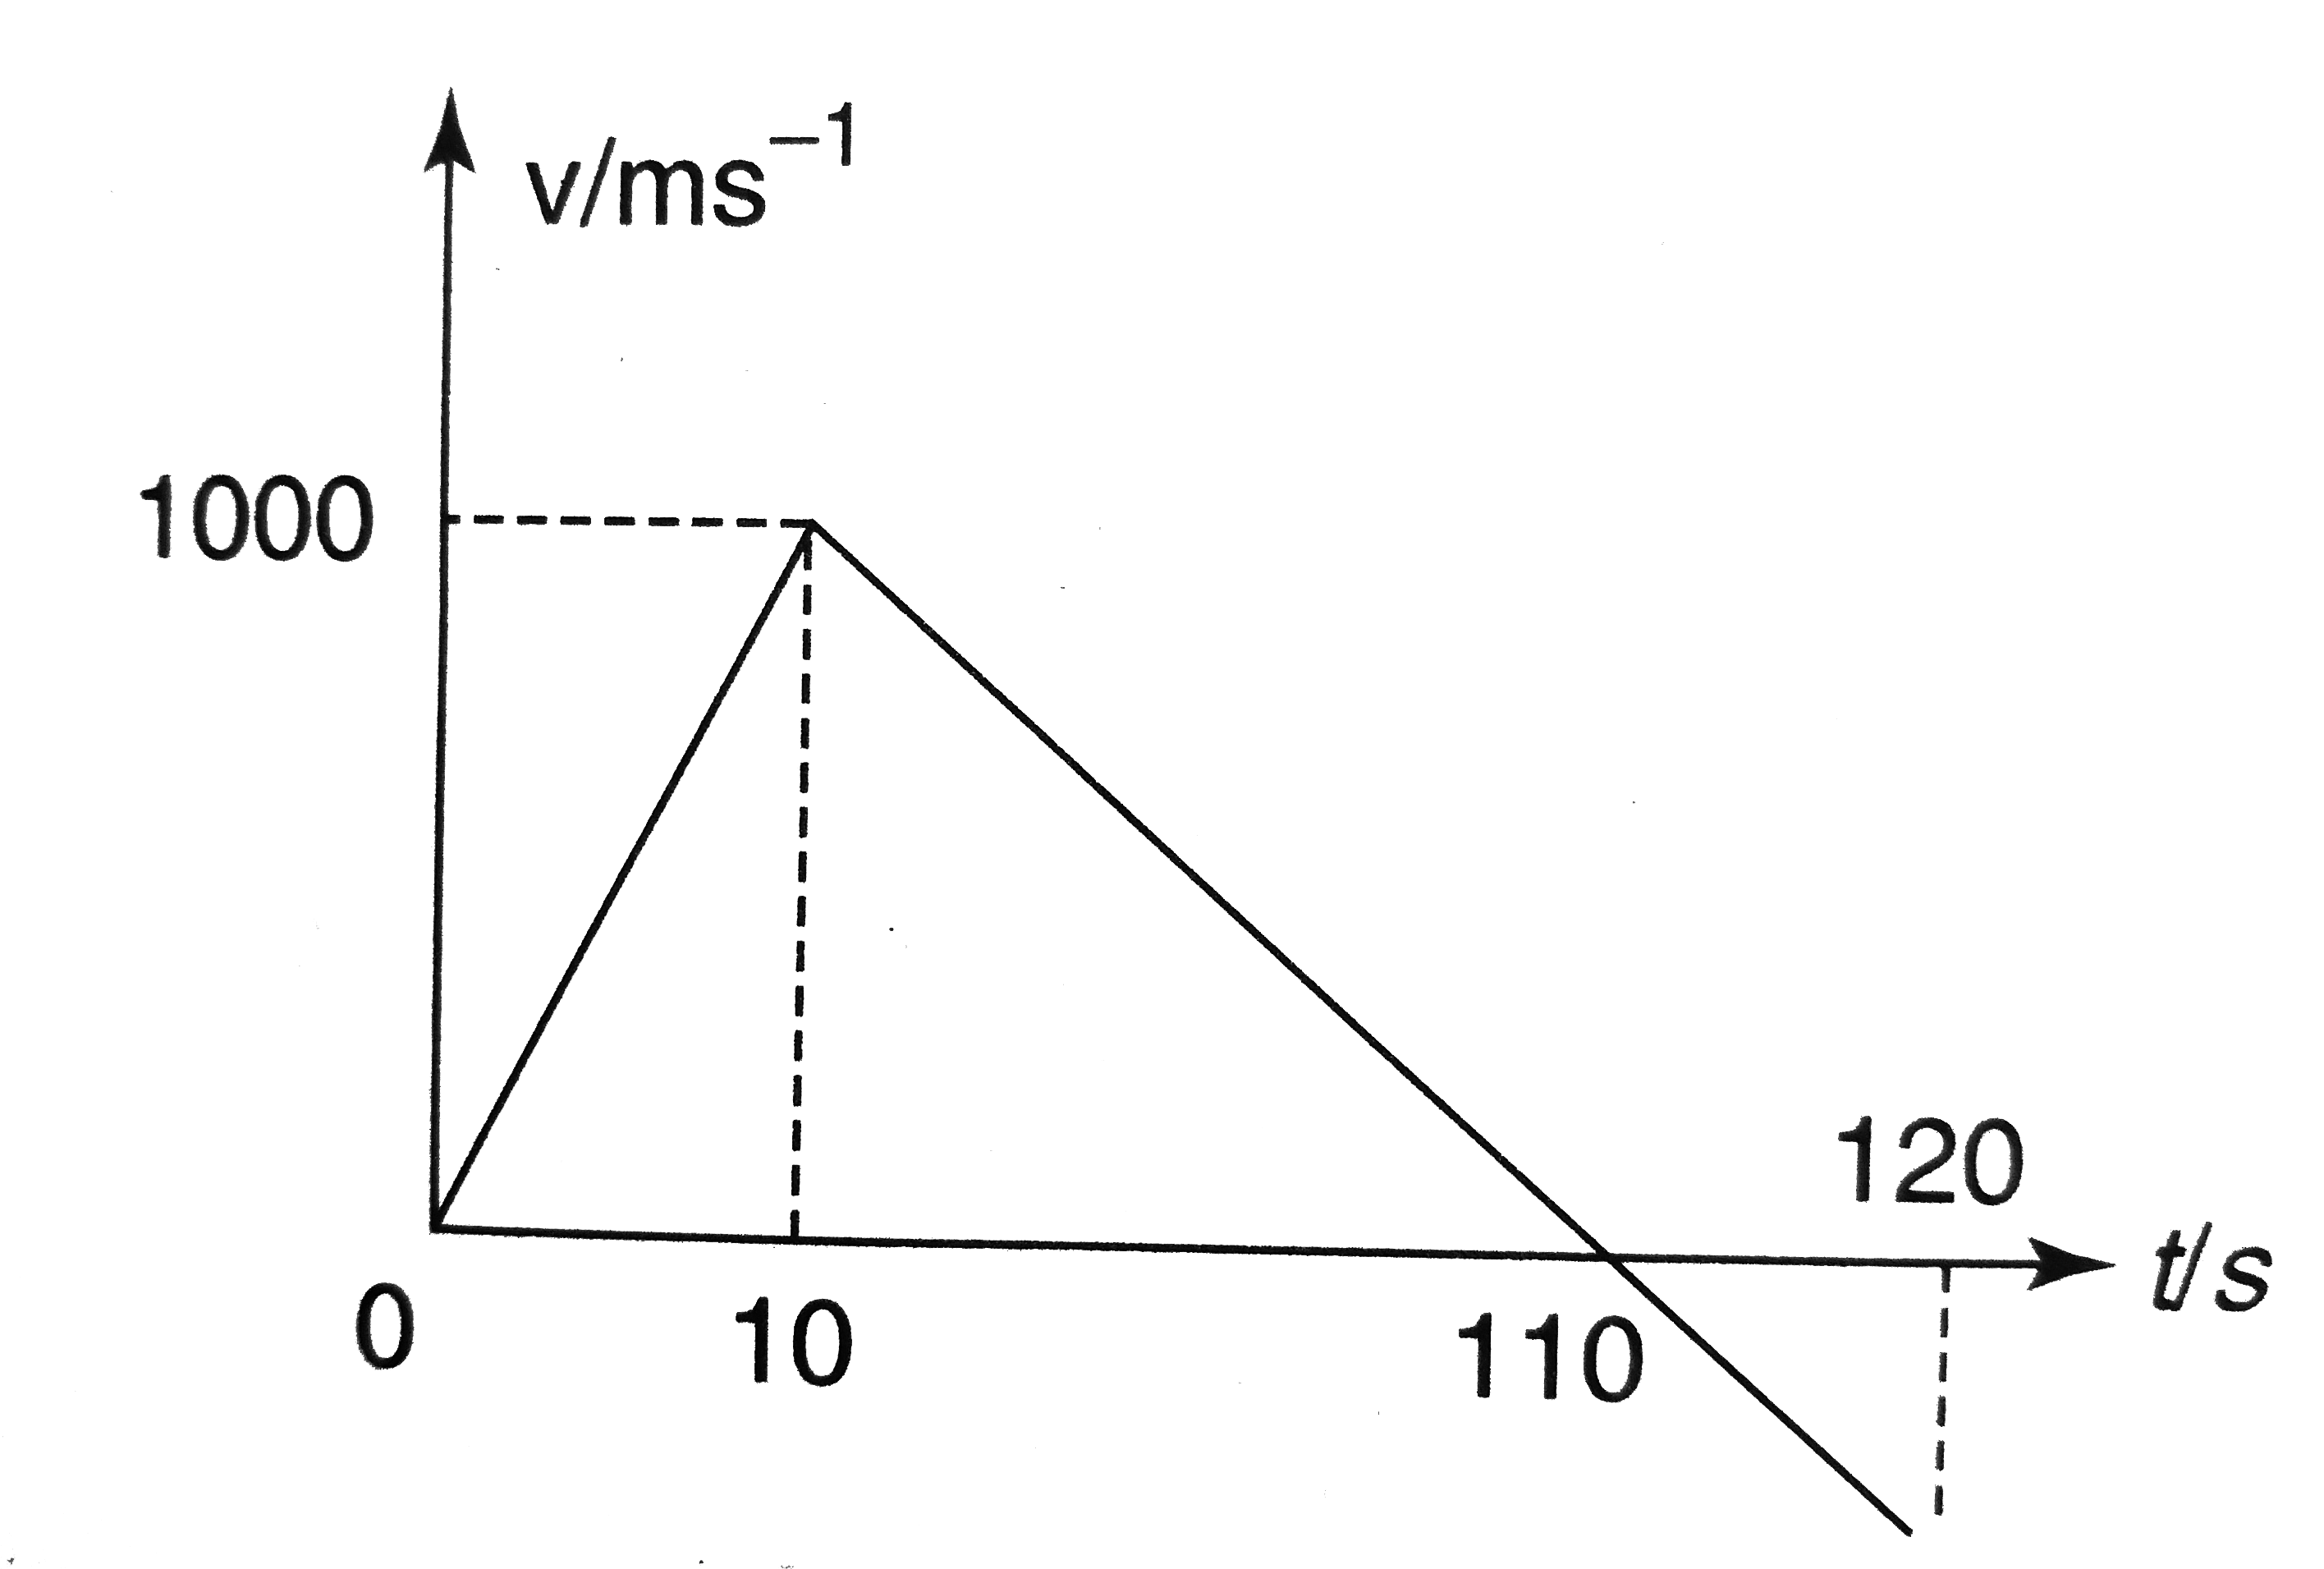
- The graph shown the variation of velocity of a rocket with time. Then,...
Text Solution
|
- The follwing graph shows the variation of velocity of a rocker with ti...
Text Solution
|
- The graph shown the variation of velocity of a rocket with time. Then,...
Text Solution
|
- A rocket is launched with velocity 10 km / s . If radius of earth is R...
Text Solution
|
- A rocket is projected vertically upwards and its time velocity graph i...
Text Solution
|
- A rocket is fired upwards. Its velocity versus time graph is shown in ...
Text Solution
|
- fig 3.36 showns the velocity time graph of a rocket projeted upwards...
Text Solution
|
- A rocket is fired vertically up from the ground with an acceleration 1...
Text Solution
|
- A rocket is fired upwards such that its engine takes 10 s to explods f...
Text Solution
|