


Similar Questions
Explore conceptually related problems
Recommended Questions
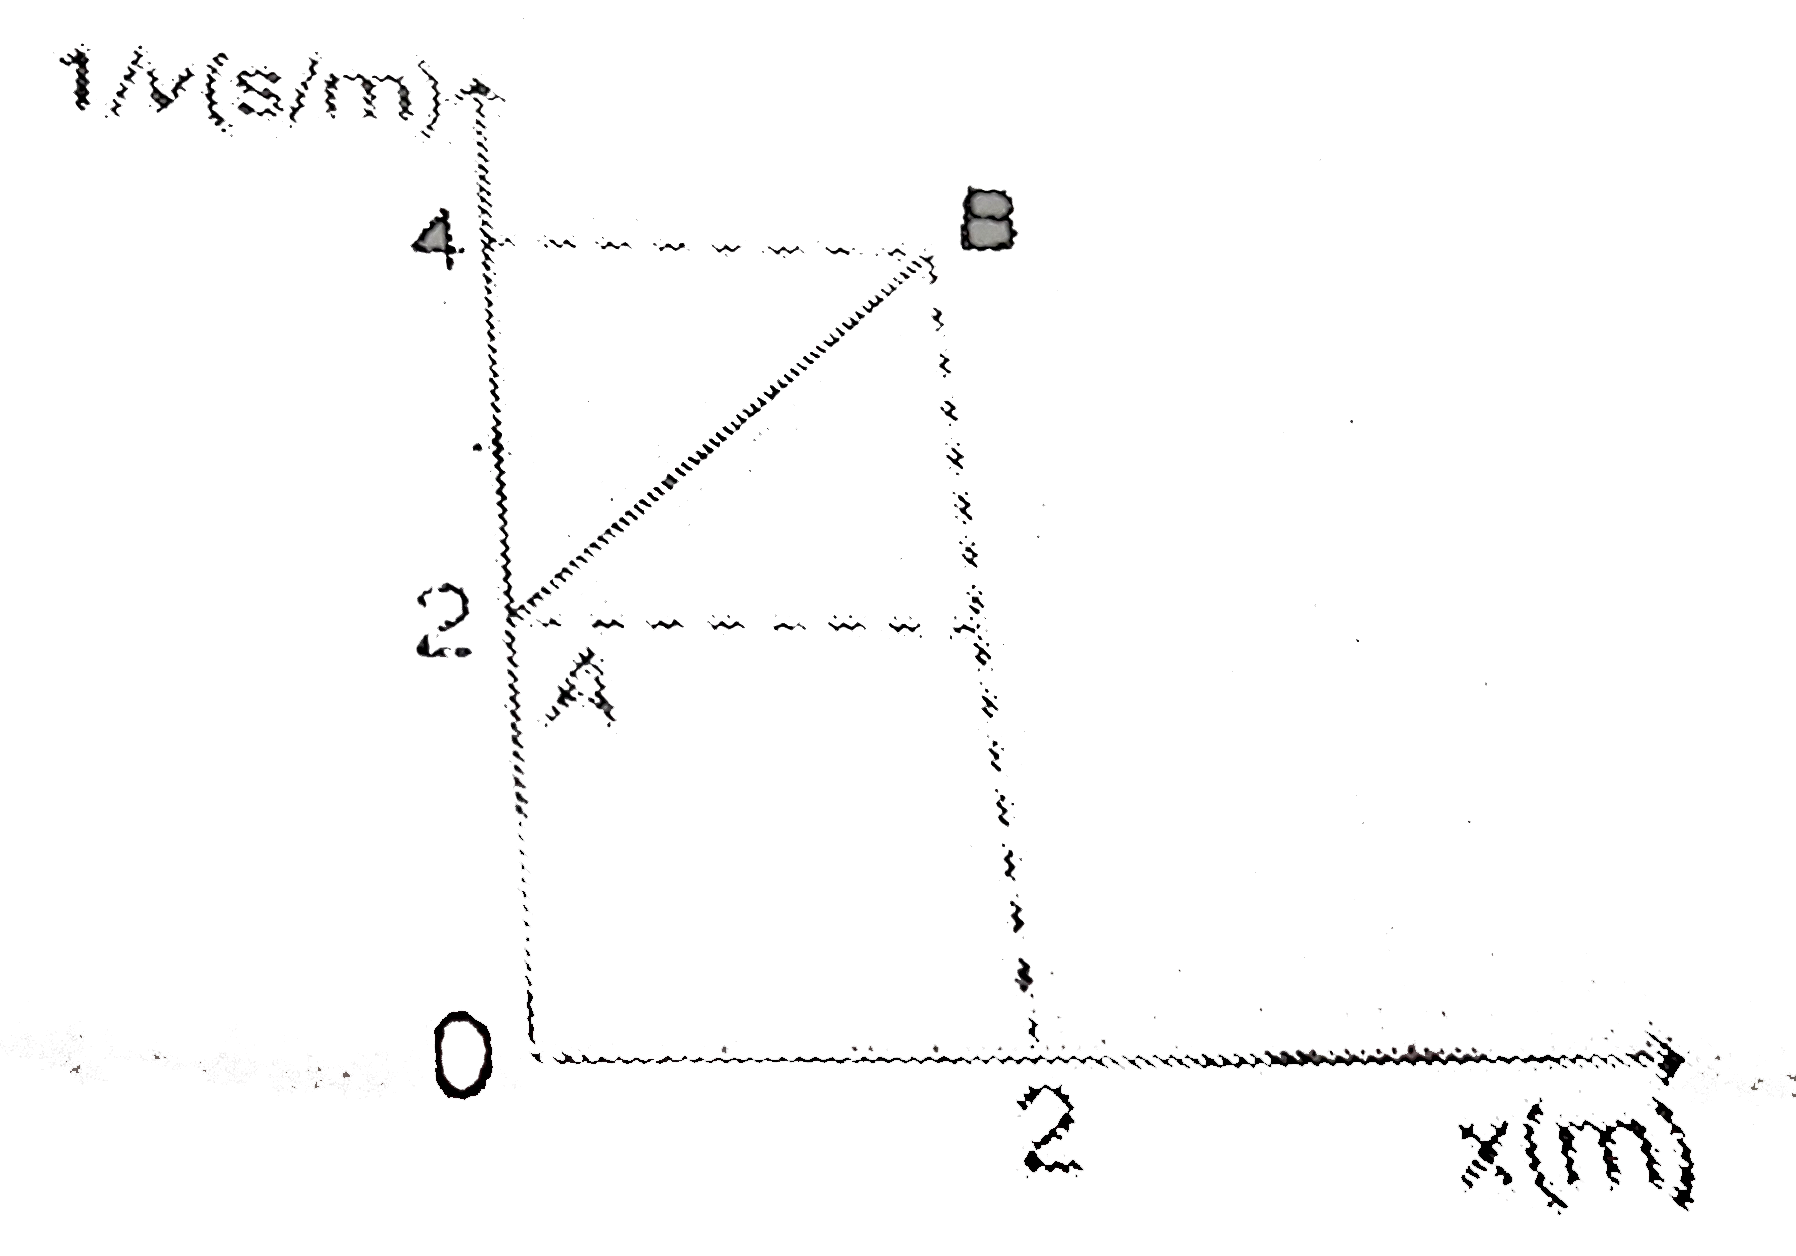
- The 1//v versus positions graph of a particle is shown in the figure, ...
Text Solution
|
- Velocity versus displacement graph of a particle moving in a straight ...
Text Solution
|
- The x-t graph of a particle moving along a straight line is shown in f...
Text Solution
|
- Graph of velocity versus displacement of a particle moving in a straig...
Text Solution
|
- The x-t graph of particle moving along a straight line is shown in fig...
Text Solution
|
- For a particle moving in a straight line, the position-time graph is a...
Text Solution
|
- A particle starts to move along a straight line. The acceleration vers...
Text Solution
|
- Graph of position (x) vs inverse of velocity ((1)/(v)) for a particle ...
Text Solution
|
- Velocity (v) versus displacement (s) graph of a particle moving in a s...
Text Solution
|