


Similar Questions
Explore conceptually related problems
Recommended Questions
- Given is the graph between (PV)/T and P for 1 gm of oxygen gas at two ...
Text Solution
|
- Given is the graph between (PV)/T and P for 1 gm of oxygen gas at two ...
Text Solution
|
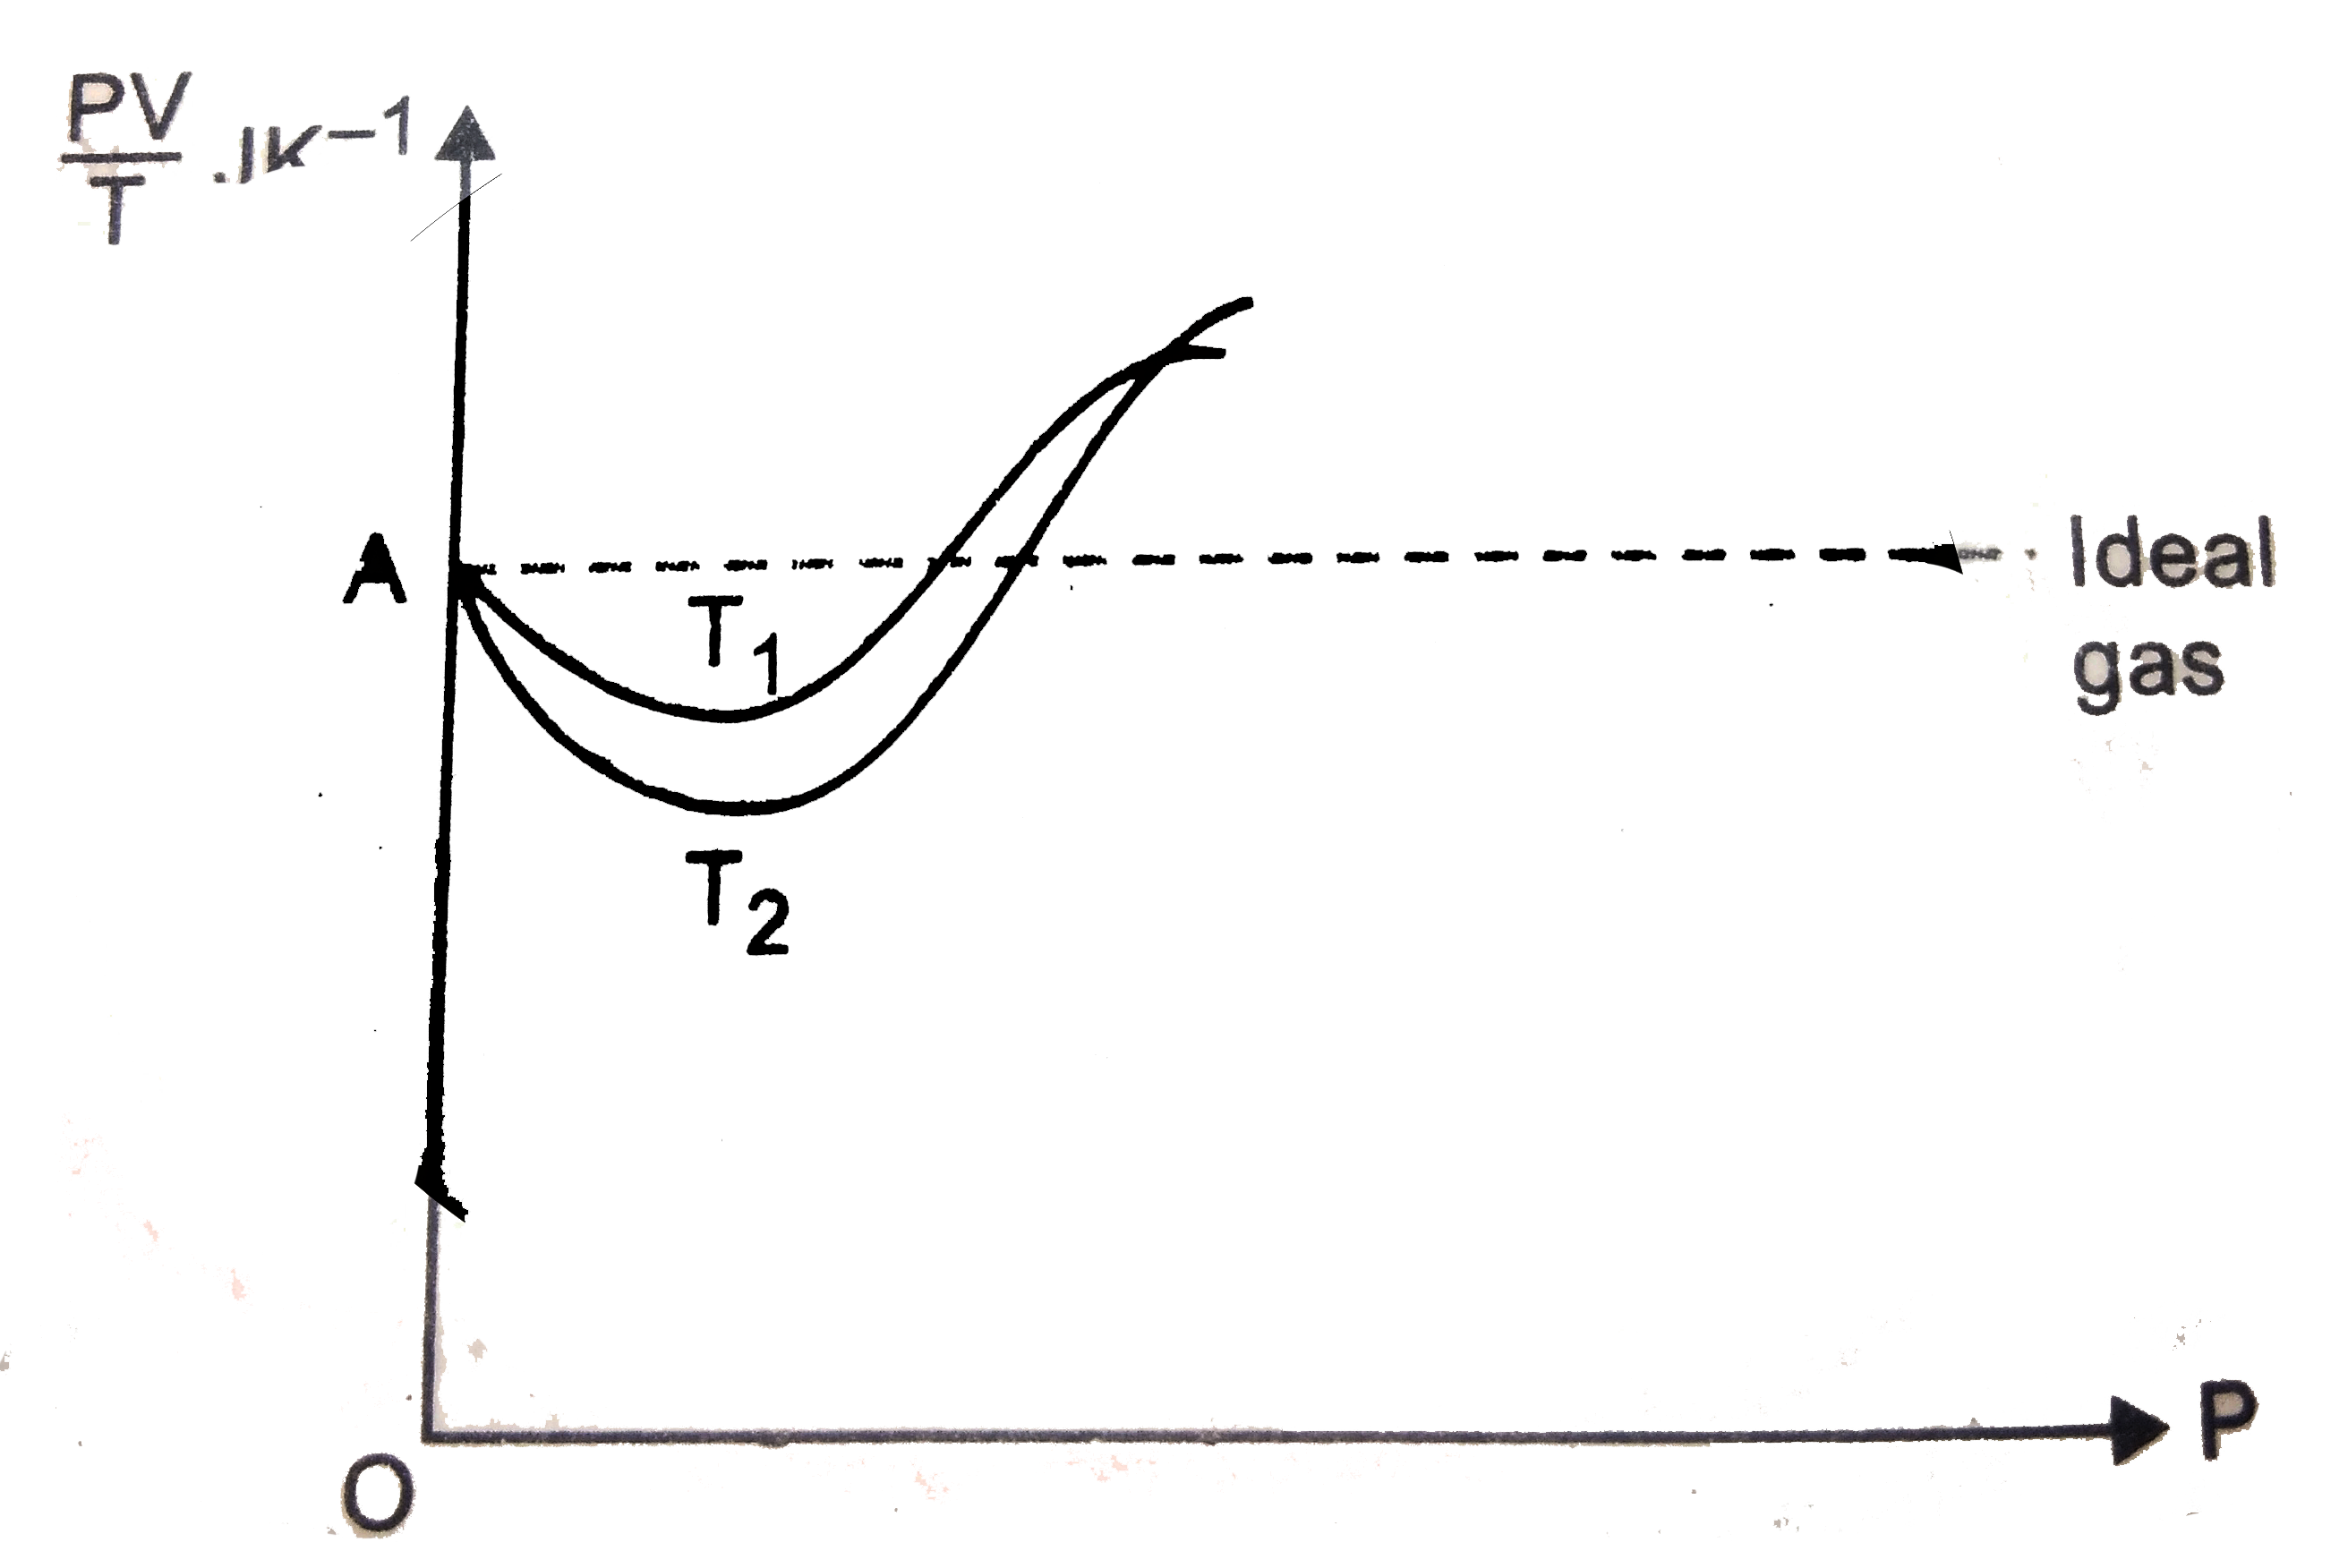
- Figure shows plot of PV//T versus P"for" 1.00 xx 10^(-3) kg of oxygen ...
Text Solution
|
- Graphs between pressure and volume are plotted at different temperatur...
Text Solution
|
- चित्र में विभवांतर V और धारा I के बीच किसी चालक के दो ताप T(1)और ...
Text Solution
|
- The density (rho) versus pressure (P) graphs of a given mass of an ide...
Text Solution
|
- At two different temperature T(1) and T(2), (T(2) gt T(1)) , draw two ...
Text Solution
|
- In the P - V diagram, the point B and C correspond to temperatures T (...
Text Solution
|
- Isothermal curves for a given mass of gas are shown at two different t...
Text Solution
|