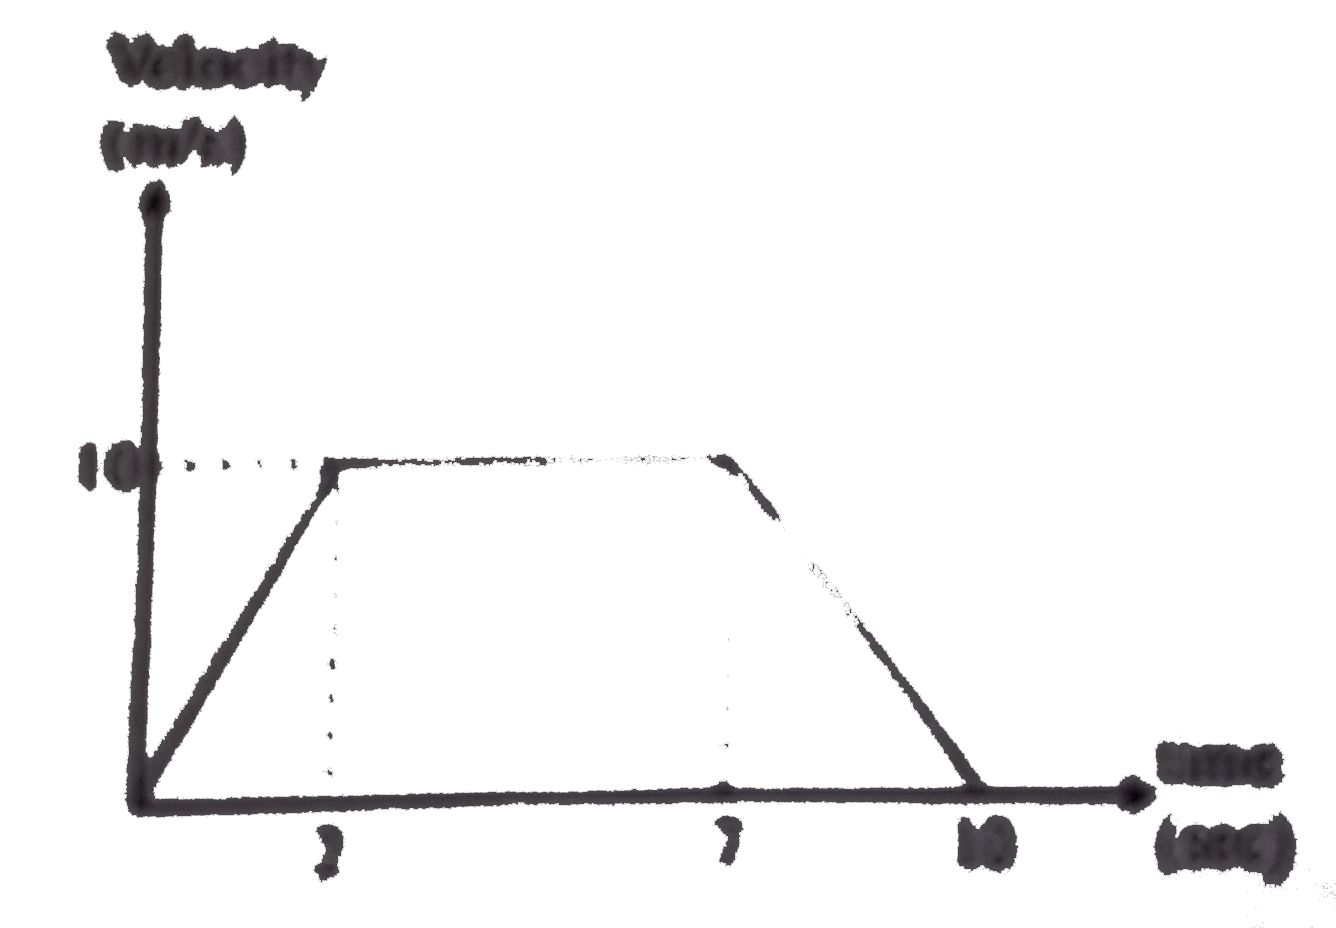
 The distance travelled by the car during the whole motion is:


Similar Questions
Explore conceptually related problems
Recommended Questions
- The velocity- time graph of car moving on a straight track is given be...
Text Solution
|
- Velocity (v) time (t) graph of a car starting from rest is shown in Fi...
Text Solution
|
- The velocity-time graph of a car moving along a straight road is shown...
Text Solution
|
- The velocity- time graph of car moving on a straight track is given be...
Text Solution
|
- The velocity- time graph of car moving on a straight track is given be...
Text Solution
|
- The velocity- time graph of car moving on a straight track is given be...
Text Solution
|
- The velocity-time graph of a car moving along a straight road is shown...
Text Solution
|
- सीधी सड़क पर चलती एक कार की चाल समय के साथ ग्राफ चित्र में दिखा...
Text Solution
|
- एक कार v चाल से सरल रेखीय गति में चल रही है । कार द्वारा t समय में ...
Text Solution
|