


Similar Questions
Explore conceptually related problems
Recommended Questions
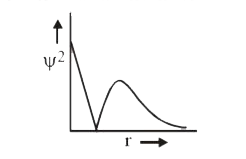
- The following graph between Psi^(2) probability density and distance f...
Text Solution
|
- Statement : All s-orbitla in H-atom corresponds to a non-zero probabil...
Text Solution
|
- For s-orbitals, since (Psi orbitals wave function) is independent of a...
Text Solution
|
- The variation of radial probability density R^2 (r) as a function of ...
Text Solution
|
- Which of the following is correct graph between Probability density sp...
Text Solution
|
- Assertion(A): psi indicates the amplitude of electron-wave psi^(2) den...
Text Solution
|
- Consider following figure A and B indicating distribution of charge de...
Text Solution
|
- Assertion. The plots of probability density and radial probability fun...
Text Solution
|
- Orbitals are the pictorial representationof Psi or Psi ^(2) Psi^(2) te...
Text Solution
|