


Similar Questions
Explore conceptually related problems
Recommended Questions
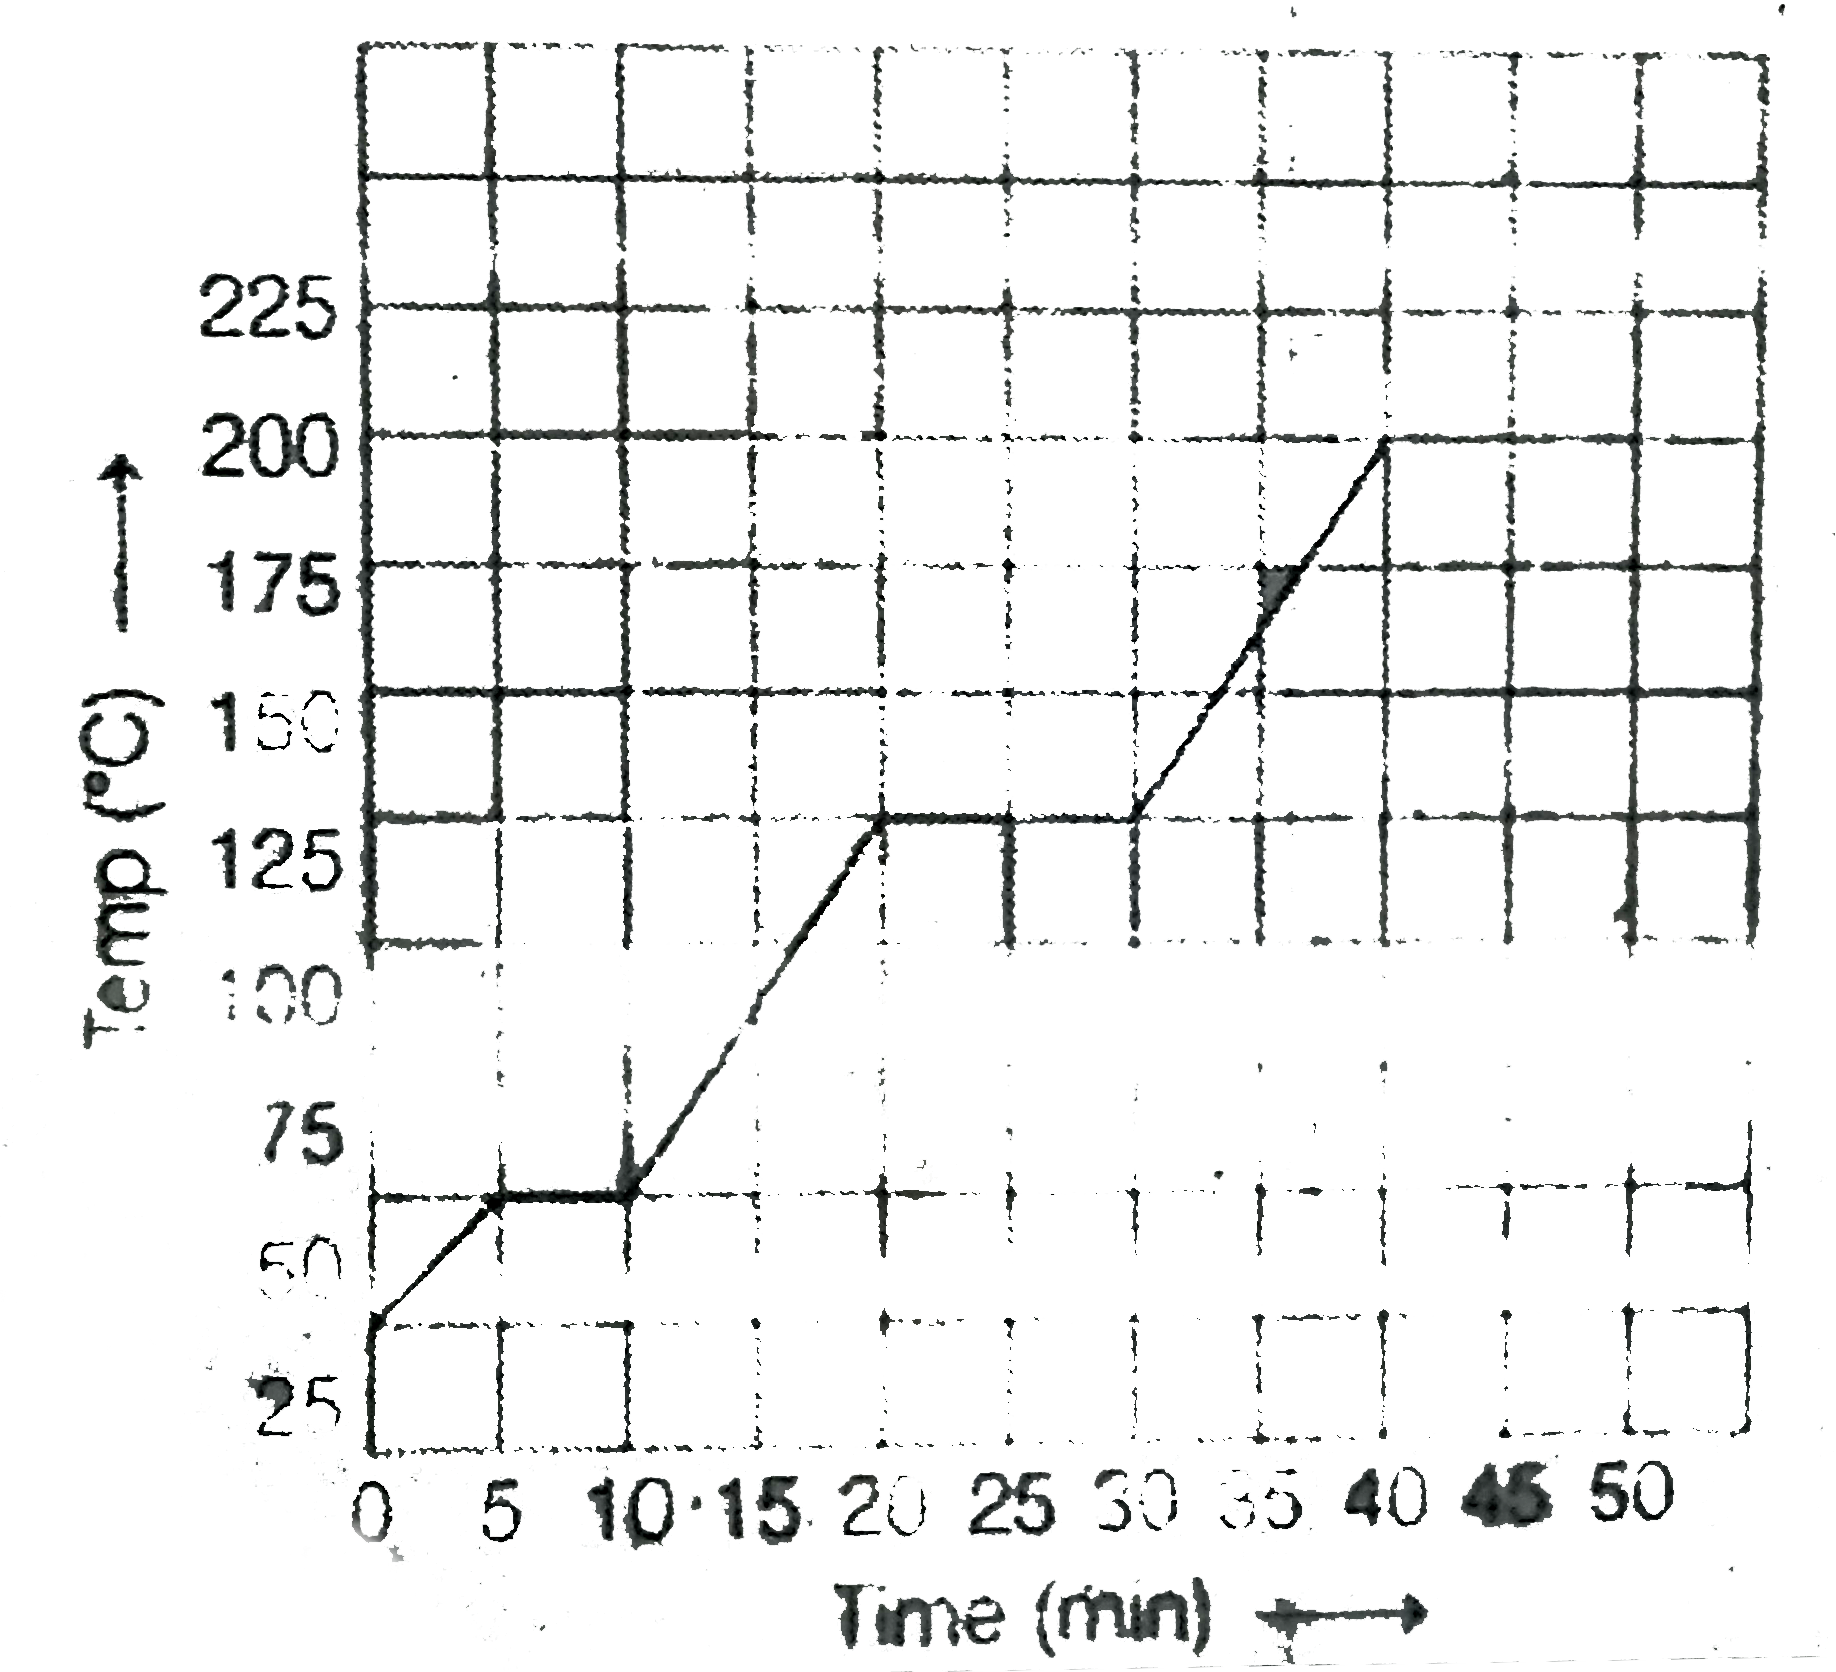
- The graph shown in the figure represents change in the temperature of ...
Text Solution
|
- The graph shown in the figure represents change in the temperature of ...
Text Solution
|
- The temperatures versus time graph is shown in figure. Which of the su...
Text Solution
|
- In figure , heat is added to a pure substance in a closed container ra...
Text Solution
|
- The heating curve of a particular substance in solid state is as shown...
Text Solution
|
- The graph given above indicates change in temperature (Delta t) when h...
Text Solution
|
- Explain the role of latent heat in the change of state of a substances
Text Solution
|
- Role of Latent heat in the change of state of a substances.
Text Solution
|
- Explain the role of latent heat in the change of state of a substance.
Text Solution
|