Text Solution
Verified by Experts


Topper's Solved these Questions
CURRENT ELECTRICITY
OSWAAL PUBLICATION|Exercise TOPIC-1 ( ELECTRIC CURRENT, RESISTANCE & CALLS) (SHORY ANSWER TYPE QUESTIONS-II)|4 VideosCURRENT ELECTRICITY
OSWAAL PUBLICATION|Exercise TOPIC-1 ( ELECTRIC CURRENT, RESISTANCE & CALLS) (LONG ANSWER TYPE QUESTIONS)|5 VideosCURRENT ELECTRICITY
OSWAAL PUBLICATION|Exercise TOPIC-3 (POTENTIOMETER & APPLICATIONS) (NUMERICAL PROBLEMS)|2 VideosCOMMUNICATION SYSTEM
OSWAAL PUBLICATION|Exercise TOPIC-3 INTERNET, MOBILE AND GPS (SHORT ANSWER TYPE QUESTIONS -I)|2 VideosDUAL NATURE OF RADIATION AND MATTER
OSWAAL PUBLICATION|Exercise TOPIC-2 DE-BROGLIE RELATION (NUMERICAL PROBLEMS)|7 Videos
Similar Questions
Explore conceptually related problems
OSWAAL PUBLICATION-CURRENT ELECTRICITY -TOPIC-1 ( ELECTRIC CURRENT, RESISTANCE & CALLS) (SHORY ANSWER TYPE QUESTIONS-I)
- Give any two practical limitations of Ohm's law.
Text Solution
|
- Calculate the value of I in the circuit given below.
Text Solution
|
- An example of a non ohmic device is
Text Solution
|
- Draw a plot showing the variation of resistivity of a (i) conductor a...
Text Solution
|
- Distinguish between emf (E) and terminal voltage (V) of a cell having ...
Text Solution
|
- Draw a plot showing the variation of terminal voltage (V) v/s the curr...
Text Solution
|
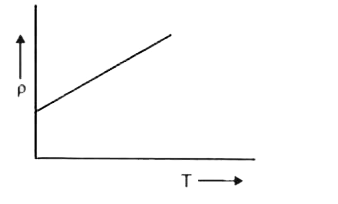
- Draw a graph showing variation of resistivity with temperature of nich...
Text Solution
|