Text Solution
Verified by Experts


Topper's Solved these Questions
DUAL NATURE OF RADIATION AND MATTER
OSWAAL PUBLICATION|Exercise TOPIC-1 PHOTOELECTRIC EFFECT (SHORT ANSWER TYPE QUESTIONS-II)|6 VideosDUAL NATURE OF RADIATION AND MATTER
OSWAAL PUBLICATION|Exercise TOPIC-1 PHOTOELECTRIC EFFECT (LONG ANSWER TYPE QUESTIONS)|4 VideosDUAL NATURE OF RADIATION AND MATTER
OSWAAL PUBLICATION|Exercise TOPIC-2 DE-BROGLIE RELATION (NUMERICAL PROBLEMS)|7 VideosCURRENT ELECTRICITY
OSWAAL PUBLICATION|Exercise TOPIC-3 (POTENTIOMETER & APPLICATIONS) (NUMERICAL PROBLEMS)|2 VideosELECTRIC CHARGES & FIELDS
OSWAAL PUBLICATION|Exercise (TOPIC -2)Numerical Problems|5 Videos
Similar Questions
Explore conceptually related problems
OSWAAL PUBLICATION-DUAL NATURE OF RADIATION AND MATTER-TOPIC-1 PHOTOELECTRIC EFFECT (SHORT ANSWER TYPE QUESTIONS-I)
- What is a photo diode? In which mode of biasing does it work?
Text Solution
|
- Mention any two importance of speed of light.
Text Solution
|
- Write Einstein's photoelectric equation.
Text Solution
|
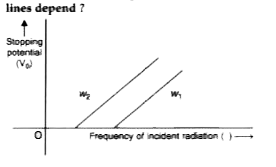
- A graph of stopping potential of a photo sensitive metal with the freq...
Text Solution
|
- A monochromatic source emitting light of wavelength 600 nm has a power...
Text Solution
|
- Two monochromatic radiations of frequencies v(1) and v(2) (v(1) gt v(2...
Text Solution
|