


Similar Questions
Explore conceptually related problems
Recommended Questions
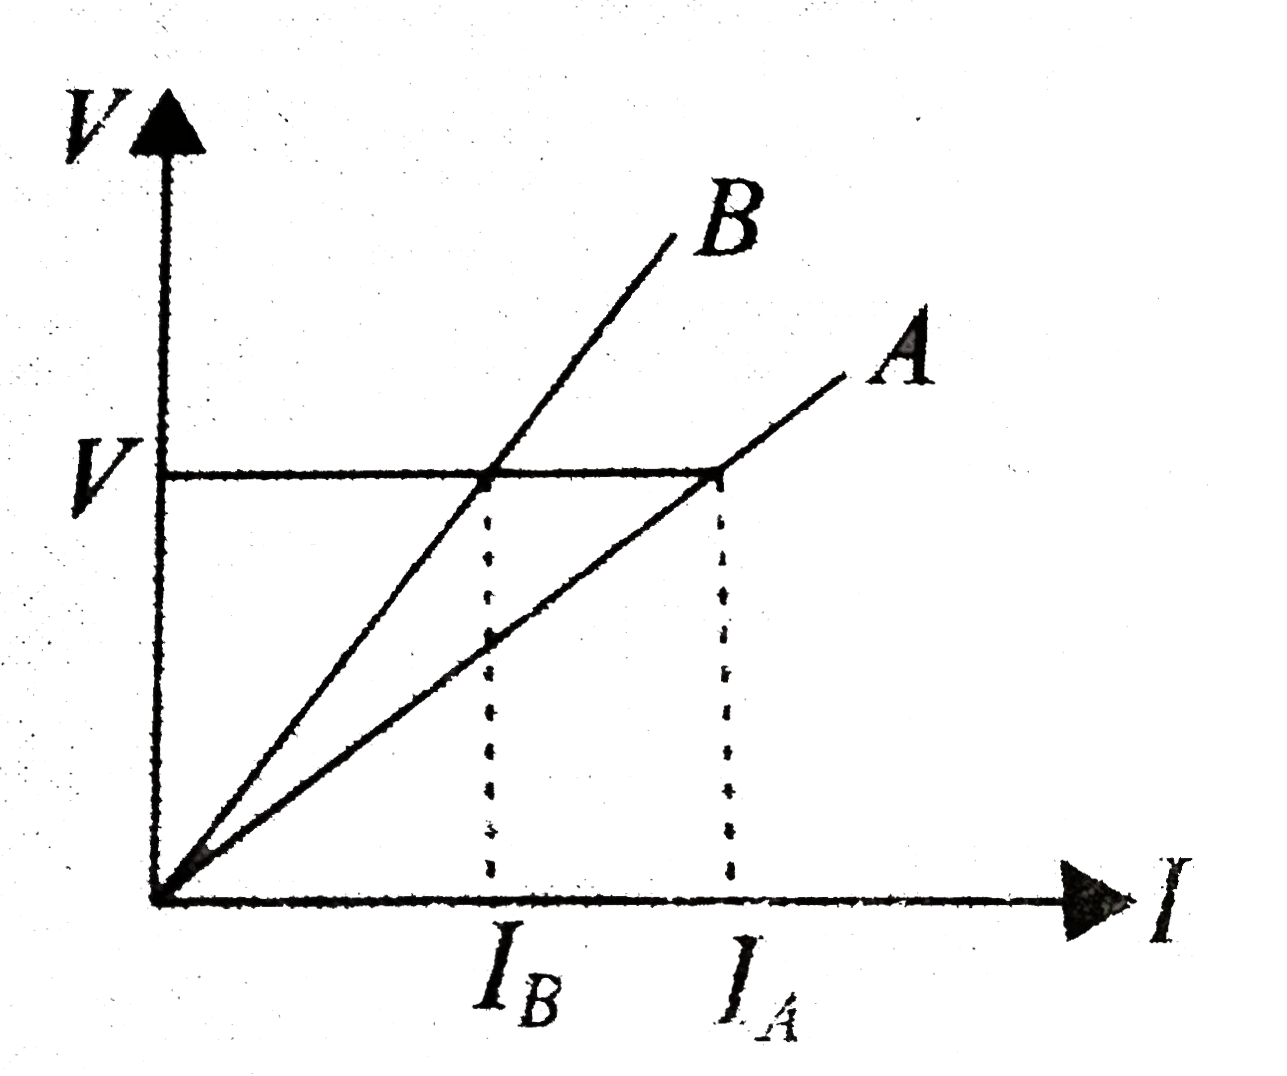
- The voltage-current graphs for two resistor of the same meterial and t...
Text Solution
|
- If l1=inte^(e^2) dx/logx and l2=int1^2 e^x/xdx, then (A) l1=2l2 (B) l1...
Text Solution
|
- The voltage-current graphs for two resistor of the same meterial and t...
Text Solution
|
- In Fig., there are two convex lenses L1 and L2 having focal lengths F1...
Text Solution
|
- The ratio of the lengths of two wires made of the same material 2:1 An...
Text Solution
|
- The lengths of two intersecting wires of the same radius are respectiv...
Text Solution
|
- दो प्रक्रम है A^(+) l1 to A^(2+) + e^(-) एवं A^(2+) +l2 to A^(3+) +...
Text Solution
|
- L1 and L2 " are two intersecting lines. If the image of " L1 " w.r.t....
Text Solution
|
- The voltage-current graphs for two resistors of the same material and ...
Text Solution
|