Text Solution
Verified by Experts
The correct Answer is:


Topper's Solved these Questions
Similar Questions
Explore conceptually related problems
NCERT BANGLISH-STATISTICS-THINK AND DISCUSS
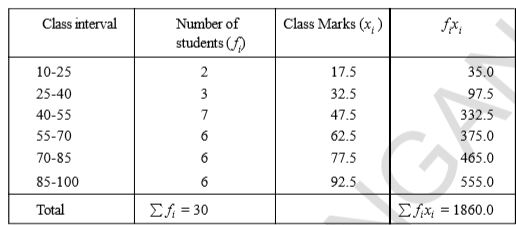
- The marks distribution of 30 students in a mathematics examination are...
Text Solution
|
- The mean value can be calculated from both ungrouped and grouped data....
Text Solution
|
- Find the median of the given data 4,6,5,7,8,4,3,2
Text Solution
|
- Find the median of the given data 10,12,13,15,16,2,10
Text Solution
|
- If x1 and fi are sufficiently small, then which method is an appropri...
Text Solution
|
- If xi and fi are numerically large numbers, then which methods are app...
Text Solution
|
- It depends upon the demand of the situation whether we are interested ...
Text Solution
|
- It depends upon the demand of the situation whether we are interested ...
Text Solution
|
- Can mode be calculated for grouped data with unequal class sizes?
Text Solution
|