Home
Class 10
MATHS
The given distribution shows the number...

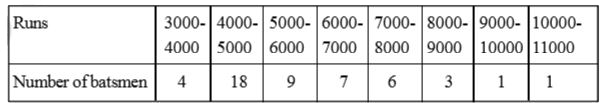
The given distribution shows the number of runs scored by some top batsmen of the world in one-day international cricket matches.

Find the mode of the data.

Text Solution

Verified by Experts

The correct Answer is:
Mode = 4608.7 runs
Promotional Banner

Topper's Solved these Questions

  • STATISTICS

    NCERT BANGLISH|Exercise Exercise 14.3|7 Videos
  • STATISTICS

    NCERT BANGLISH|Exercise Exercise 14.4|3 Videos
  • STATISTICS

    NCERT BANGLISH|Exercise Exercise 14.1|9 Videos
  • SIMILAR TRIANGLES

    NCERT BANGLISH|Exercise TRY THIS|6 Videos
  • TANGENTS AND SECANTS TO A CIRCLE

    NCERT BANGLISH|Exercise Try this|5 Videos

Similar Questions

Explore conceptually related problems

The below distribution shows the numbers of wickets taken by bowkers in one-day cricket matches. Find the mean number of wickets by choosing a suitable method. What does the mean signify ?

The wickets taken by a bowler in 10 cricket matches are as follows: 2,6,4,5,0,2,1,3,2,3. Find the mode of the data.

Centuries scored and number of cricketers in the world are given below. Find the mean, median and mode of the given data.

The frequency distribution of the number of accidents in 30 consecutive days in a city are given below. Find the arithmetic mean.

The following distribution distribution given the state-wise, teacher-student ratio in higher secondary schools of India. Find the mode and mean of this data. Interpret the two measures.

The given frequency distribution table shows the age of 200 members of development committee of our locality.find mode

A student noted the number of cars passing thorugh a spot on a road for 100 periods, each of 3 minutes, and summarised this in the table given below. Find the mode of the data.

The marks distribution of 30 students in a mathematics examination are given in the adjacent table. Find the mode of this data. Also compare and interpret the mode and the mean .

The following table shows the ages of the patients admitted in a hospital on a particular day : Find the mode and the mean of the data given below. Compare and interpret the two measures of central tendency.

On the occasion of New year's day a sweet stall prepared sweet packets. Number of sweet packets and cost of each packet are given as follows. Find the mean, median and mode of the data.