Text Solution
Verified by Experts
The correct Answer is:


Topper's Solved these Questions
Similar Questions
Explore conceptually related problems
NCERT BANGLISH-STATISTICS-Exercise 14.3
- Find the mode of the given data 15,11,10,8,15,18,17,15
Text Solution
|
- If the median of 60 observations, given below is 28.5, find the values...
Text Solution
|
- A life insurance agent found the following data about distribution of ...
Text Solution
|
- Find the mode of the given data 3,5,4,6,5,4,5,7,5
Text Solution
|
- The following table gives the distribution of the life-time of 400 neo...
Text Solution
|
- Find the mode of the given data 8,5,4,6,7,4,4,3,5,4,5,4,4,4,3
Text Solution
|
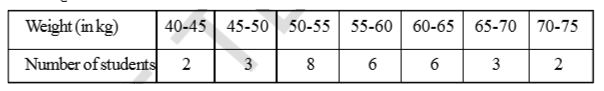
- The distribution below gives the weights of 30 students of a class. Fi...
Text Solution
|